Nebraska Department of Environment and Energy

Air Water Land Energy

Nebraska Energy Statistics

Average Monthly Retail
Motor Gasoline Prices
in Nebraska

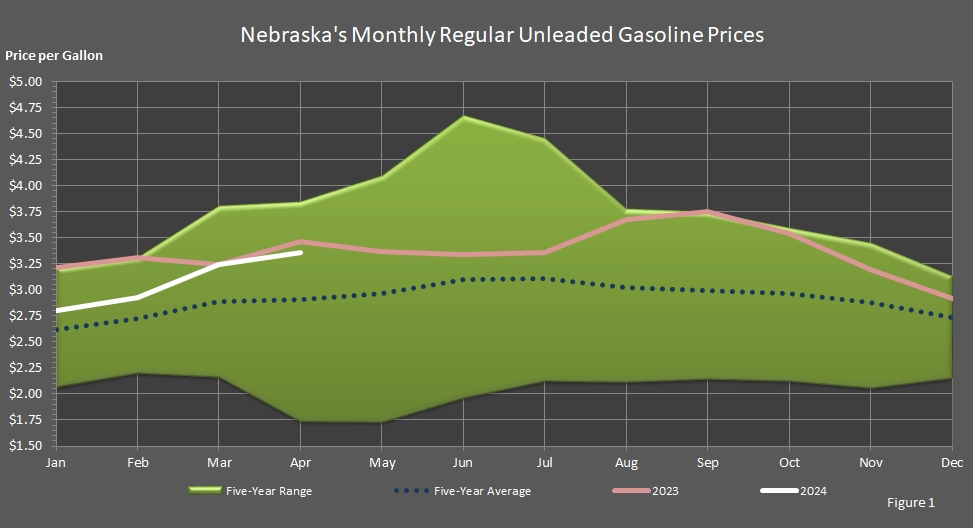
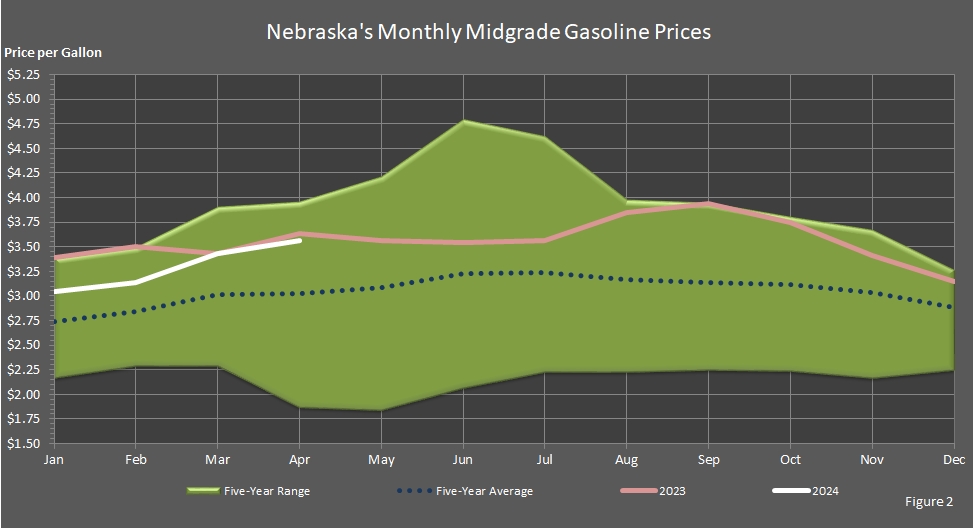
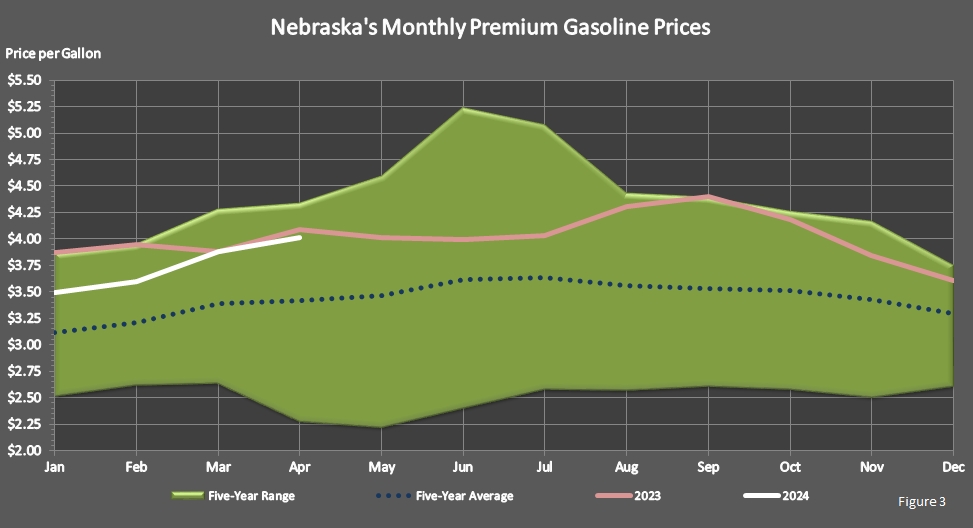
Regular unleaded gasoline has an octane greater than or equal to 85 and less than 88. Midgrade motor gasoline has an octane greater than or equal to 88 and less than or equal to 90, which includes some octane boosters (this includes E-10 in Nebraska). Premium gasoline has an octane greater than 90.

Average monthly prices can also be viewed for the following cities: Columbus, Grand Island, Kearney, Lincoln, Norfolk, North Platte, and Omaha.

Weekly average prices are available.

Today's average state price can be found in the State Gas Prices report. Scroll down in the report to find today's average metro prices for motor gasoline.

indicates a rule of thumb follows. A general rule of thumb: A dollar increase in the West Texas Intermediate (WTI) crude oil price per barrel will result in a 2.5–cent increase in the price of gasoline per gallon. Likewise, a dollar decrease in the WTI crude oil price per barrel will result in a 2.5–cent decrease in the price of gasoline per gallon.

Return to top of page

line chart showing Average Monthly Retail Nebraska Regular Unleaded Gasoline Prices.

Return to top of page

Average Monthly Retail
Nebraska Regular Unleaded Gasoline Prices

Grade–Regular Unleaded
Year Jan Feb Mar Apr May Jun Jul Aug Sep Oct Nov Dec
2024 $2.80 $2.93 $3.24 NA NA NA NA NA NA NA NA NA
2023 $3.21 $3.31 $3.24 $3.46 $3.37 $3.34 $3.36 $3.67 $3.75 $3.54 $3.19 $2.92
2022 $3.12 $3.31 $3.80 $3.84 $4.09 $4.67 $4.45 $3.78 $3.57 $3.59 $3.45 $3.04
2021 $2.29 $2.49 $2.78 $2.79 $2.88 $2.91 $2.99 $3.02 $3.02 $3.11 $3.21 $3.13
2020 $2.42 $2.33 $2.16 $1.74 $1.73 $1.96 $2.12 $2.11 $2.14 $2.12 $2.06 $2.15
2019 $2.07 $2.20 $2.48 $2.72 $2.75 $2.62 $2.61 $2.52 $2.48 $2.48 $2.47 $2.42
2018 $2.50 $2.57 $2.53 $2.60 $2.78 $2.81 $2.75 $2.74 $2.76 $2.82 $2.53 $2.18
2017 $2.36 $2.33 $2.30 $2.35 $2.31 $2.26 $2.22 $2.32 $2.52 $2.42 $2.54 $2.42
2016 $1.87 $1.68 $1.98 $2.07 $2.22 $2.33 $2.22 $2.17 $2.21 $2.24 $2.13 $2.19
2015 $2.01 $2.18 $2.42 $2.40 $2.56 $2.68 $2.71 $2.68 $2.46 $2.43 $2.25 $2.01
2014 $3.19 $3.32 $3.53 $3.59 $3.52 $3.55 $3.50 $3.41 $3.36 $3.18 $3.00 $2.51
2013 $3.19 $3.64 $3.66 $3.48 $3.76 $3.64 $3.56 $3.59 $3.61 $3.31 $3.12 $3.10
2012 $3.27 $3.49 $3.80 $3.81 $3.61 $3.50 $3.50 $3.71 $3.88 $3.70 $3.38 $3.26
2011 $3.15 $3.23 $3.56 $3.81 $3.93 $3.72 $3.68 $3.66 $3.67 $3.46 $3.41 $3.26
2010 $2.74 $2.66 $2.83 $2.90 $2.87 $2.73 $2.77 $2.80 $2.79 $2.85 $2.89 $3.00
2009 $1.82 $1.90 $1.96 $2.06 $2.29 $2.66 $2.48 $2.62 $2.53 $2.56 $2.69 $2.64
2008 $3.04 $3.07 $3.24 $3.41 $3.73 $3.96 $4.00 $3.72 $3.66 $2.92 $2.04 $1.70
2007 $2.18 $2.29 $2.60 $2.82 $3.23 $3.12 $3.17 $2.95 $2.97 $2.84 $3.13 $3.01
2006 $2.33 $2.30 $2.46 $2.75 $2.83 $2.80 $2.96 $3.00 $2.45 $2.24 $2.27 $2.33
2005 $1.82 $1.94 $2.09 $2.24 $2.13 $2.14 $2.28 $2.49 $2.89 $2.61 $2.20 $2.21
2004 $1.56 $1.62 $1.71 $1.77 $1.98 $1.95 $1.89 $1.89 $1.86 $1.98 $1.96 $1.82
2003 $1.47 $1.63 $1.68 $1.55 $1.52 $1.51 $1.52 $1.62 $1.63 $1.56 $1.51 $1.47
2002 $1.15 $1.15 $1.30 $1.43 $1.41 $1.39 $1.43 $1.44 $1.43 $1.50 $1.47 $1.39
2001 $1.48 $1.52 $1.44 $1.56 $1.77 $1.65 $1.36 $1.48 $1.70 $1.36 $1.20 $1.12
2000 $1.29 $1.40 $1.52 $1.44 $1.49 $1.70 $1.59 $1.47 $1.59 $1.58 $1.56 $1.46
1999 NA NA NA NA $1.13 $1.12 $1.17 $1.22 $1.26 $1.25 $1.23 $1.27

Return to top of page

line chart showing Average Monthly Retail Nebraska Midgrade Gasoline Prices.

Return to top of page

Average Monthly Retail
Nebraska Midgrade Gasoline Prices

Grade–Midgrade
Year Jan Feb Mar Apr May Jun Jul Aug Sep Oct Nov Dec
2024 $3.04 $3.14 $3.43 NA NA NA NA NA NA NA NA NA
2023 $3.39 $3.50 $3.43 $3.63 $3.56 $3.54 $3.56 $3.85 $3.94 $3.75 $3.41 $3.15
2022 $3.23 $3.41 $3.90 $3.95 $4.21 $4.79 $4.61 $3.97 $3.76 $3.80 $3.67 $3.26
2021 $2.39 $2.58 $2.87 $2.89 $2.98 $3.02 $3.10 $3.14 $3.14 $3.22 $3.32 $3.24
2020 $2.53 $2.44 $2.29 $1.87 $1.84 $2.06 $2.23 $2.23 $2.25 $2.24 $2.17 $2.25
2019 $2.17 $2.29 $2.57 $2.80 $2.84 $2.72 $2.71 $2.63 $2.58 $2.58 $2.58 $2.53
2018 $2.52 $2.60 $2.58 $2.66 $2.84 $2.88 $2.82 $2.84 $2.85 $2.92 $2.63 $2.29
2017 $2.37 $2.35 $2.32 $2.36 $2.32 $2.27 $2.24 $2.33 $2.54 $2.44 $2.55 $2.45
2016 $1.91 $1.68 $1.99 $2.07 $2.20 $2.29 $2.19 $2.18 $2.22 $2.25 $2.14 $2.21
2015 $2.04 $2.22 $2.46 $2.44 $2.60 $2.71 $2.73 $2.69 $2.47 $2.45 $2.29 $2.08
2014 $3.17 $3.29 $3.51 $3.58 $3.53 $3.58 $3.52 $3.43 $3.37 $3.19 $3.03 $2.54
2013 $3.11 $3.57 $3.58 $3.39 $3.68 $3.54 $3.47 $3.50 $3.53 $3.26 $3.07 $3.06
2012 $3.19 $3.41 $3.72 $3.72 $3.51 $3.41 $3.41 $3.63 $3.80 $3.60 $3.29 $3.17
2011 $3.22 $3.18 $3.48 $3.73 $3.85 $3.63 $3.60 $3.58 $3.58 $3.38 $3.32 $3.17
2010 $2.80 $2.72 $2.89 $2.97 $2.93 $2.79 $2.83 $2.87 $2.85 $2.91 $2.95 $3.07
2009 $1.86 $1.94 $2.01 $2.11 $2.35 $2.72 $2.54 $2.68 $2.59 $2.61 $2.75 $2.70
2008 $3.11 $3.14 $3.31 $3.49 $3.81 $4.04 $4.09 $3.79 $3.72 $2.98 $2.08 $1.74
2007 $2.23 $2.34 $2.66 $2.88 $3.30 $3.19 $3.24 $3.01 $3.04 $2.91 $3.20 $3.08
2006 $2.38 $2.35 $2.51 $2.82 $2.89 $2.87 $3.03 $3.06 $2.50 $2.29 $2.32 $2.38
2005 $1.86 $1.98 $2.14 $2.29 $2.17 $2.19 $2.33 $2.55 $2.95 $2.67 $2.25 $2.26
2004 $1.60 $1.65 $1.75 $1.81 $2.02 $2.00 $1.93 $1.93 $1.90 $2.03 $2.00 $1.86
2003 $1.50 $1.67 $1.71 $1.58 $1.55 $1.55 $1.55 $1.66 $1.67 $1.59 $1.55 $1.50
2002 $1.18 $1.17 $1.33 $1.47 $1.44 $1.42 $1.46 $1.47 $1.47 $1.53 $1.51 $1.42
2001 $1.51 $1.56 $1.48 $1.60 $1.81 $1.68 $1.39 $1.51 $1.74 $1.39 $1.22 $1.15
2000 $1.31 $1.43 $1.53 $1.44 $1.50 $1.73 $1.62 $1.50 $1.62 $1.61 $1.59 $1.50
1999 NA NA NA NA $1.15 $1.14 $1.20 $1.25 $1.29 $1.28 $1.26 $1.30

Return to top of page

line chart showing Average Monthly Retail Nebraska Premium Gasoline Prices.

Return to top of page

Average Monthly Retail
Nebraska Premium Gasoline Prices

Grade–Premium
Year Jan Feb Mar Apr May Jun Jul Aug Sep Oct Nov Dec
2024 $3.49 $3.60 $3.88 NA NA NA NA NA NA NA NA NA
2023 $3.87 $3.95 $3.88 $4.09 $4.01 $3.99 $4.03 $4.31 $4.40 $4.18 $3.84 $3.61
2022 $3.59 $3.77 $4.28 $4.34 $4.59 $5.24 $5.08 $4.43 $4.22 $4.26 $4.17 $3.75
2021 $2.74 $2.94 $3.24 $3.24 $3.34 $3.38 $3.46 $3.50 $3.49 $3.58 $3.68 $3.60
2020 $2.88 $2.78 $2.64 $2.28 $2.22 $2.40 $2.58 $2.57 $2.61 $2.58 $2.51 $2.61
2019 $2.52 $2.62 $2.90 $3.13 $3.18 $3.05 $3.04 $2.98 $2.93 $2.94 $2.94 $2.89
2018 $2.89 $2.95 $2.93 $3.01 $3.18 $3.23 $3.16 $3.15 $3.18 $3.25 $2.99 $2.66
2017 $2.76 $2.74 $2.71 $2.75 $2.72 $2.67 $2.63 $2.71 $2.91 $2.81 $2.92 $2.83
2016 $2.29 $2.08 $2.33 $2.45 $2.58 $2.70 $2.63 $2.59 $2.63 $2.68 $2.57 $2.62
2015 $2.34 $2.49 $2.74 $2.72 $2.86 $3.01 $3.05 $3.11 $2.94 $2.91 $2.72 $2.46
2014 $3.44 $3.57 $3.78 $3.85 $3.80 $3.84 $3.79 $3.71 $3.65 $3.44 $3.30 $2.83
2013 $3.38 $3.82 $3.84 $3.65 $3.96 $3.83 $3.77 $3.84 $3.85 $3.56 $3.38 $3.36
2012 $3.41 $3.63 $3.95 $3.95 $3.74 $3.65 $3.65 $3.89 $4.06 $3.89 $3.58 $3.45
2011 $3.31 $3.37 $3.69 $3.94 $4.07 $3.84 $3.80 $3.79 $3.79 $3.60 $3.55 $3.40
2010 $2.88 $2.80 $2.97 $3.05 $3.01 $2.87 $2.91 $2.95 $2.93 $3.00 $3.03 $3.16
2009 $1.91 $1.99 $2.06 $2.16 $2.41 $2.79 $2.61 $2.75 $2.66 $2.69 $2.83 $2.77
2008 $3.20 $3.23 $3.40 $3.59 $3.92 $4.16 $4.20 $3.89 $3.83 $3.06 $2.13 $1.78
2007 $2.29 $2.41 $2.73 $2.96 $3.40 $3.28 $3.33 $3.10 $3.12 $2.99 $3.29 $3.16
2006 $2.45 $2.42 $2.58 $2.89 $2.97 $2.95 $3.11 $3.15 $2.57 $2.35 $2.38 $2.45
2005 $1.91 $2.04 $2.20 $2.36 $2.24 $2.25 $2.40 $2.62 $3.03 $2.75 $2.32 $2.33
2004 $1.64 $1.70 $1.80 $1.86 $2.08 $2.05 $1.98 $1.98 $1.96 $2.08 $2.06 $1.91
2003 $1.55 $1.71 $1.76 $1.62 $1.60 $1.59 $1.59 $1.70 $1.71 $1.64 $1.59 $1.54
2002 $1.21 $1.21 $1.37 $1.51 $1.48 $1.46 $1.50 $1.51 $1.51 $1.58 $1.55 $1.46
2001 $1.55 $1.60 $1.52 $1.64 $1.86 $1.73 $1.42 $1.55 $1.78 $1.43 $1.26 $1.18
2000 $1.35 $1.47 $1.57 $1.47 $1.54 $1.77 $1.67 $1.55 $1.67 $1.66 $1.63 $1.54
1999 NA NA NA NA $1.18 $1.17 $1.23 $1.28 $1.32 $1.32 $1.29 $1.33

Return to top of page

Source: Nebraska Department of Environment and Energy, Lincoln, NE.

Note: NA indicates that data is not available.

The tables and graphs were updated on April 3, 2024.
Typically, there is one month between updates.

Return to top of page