Nebraska Department of Environment and Energy

Air Water Land Energy

Nebraska Energy Statistics

Nebraska's Degree Days

Introduction

Freezing weather during the winter or sweltering weather during the summer can increase your utility bills. You can find out how much of the rise in cost is a result of the weather by using a unit of measure called the "degree day".

Degree days are used to estimate fuel consumption and to pinpoint the nominal annual heating and cooling loads of a building. A degree day is a 1 degree Fahrenheit difference between 65 degrees Fahrenheit and the average outdoor air temperature on a given day. The more extreme the temperature, the higher the number of degree days. Degree day measurements can be used to describe the effect of outdoor temperature on the amount of energy needed for space heating or cooling. Hot days, which could require the use of energy for cooling, are measured in cooling degree days. On a day with an average temperature of 90 degrees Fahrenheit, 25 cooling degree days would be recorded. Cold days are measured in heating degree days. For a day with an average temperature of 45 degrees Fahrenheit, 20 heating degree days would be recorded. Two such cold days would result in a total of 40 heating degree days for the two–day period.

By studying degree day patterns in an area, the increases or decreases in heating or air conditioning bills can be evaluated from year to year. The Nebraska Department of Environment and Energy maintains degree days and degree day normals for twelve cities around the state in addition to the state's degree days. By studying the locator map, find the city to which you are closest and use that city's degree days. Degree day information may also be published in a local newspaper, usually in the weather section. Information could be available from a local utility. Its public relations department may be able to provide the number of degree days in the last billing period and how it compares to the number of degree days in previous billing periods. Recently, the National Oceanic and Atmospheric Administration's National Climatic Data Center has built a webpage where you can find degree days for any state/station for no fee. The data is available for January 1895 to last month: All Nebraska Stations. The normals are found here: All Nebraska Stations' 1981-2010 Normals.

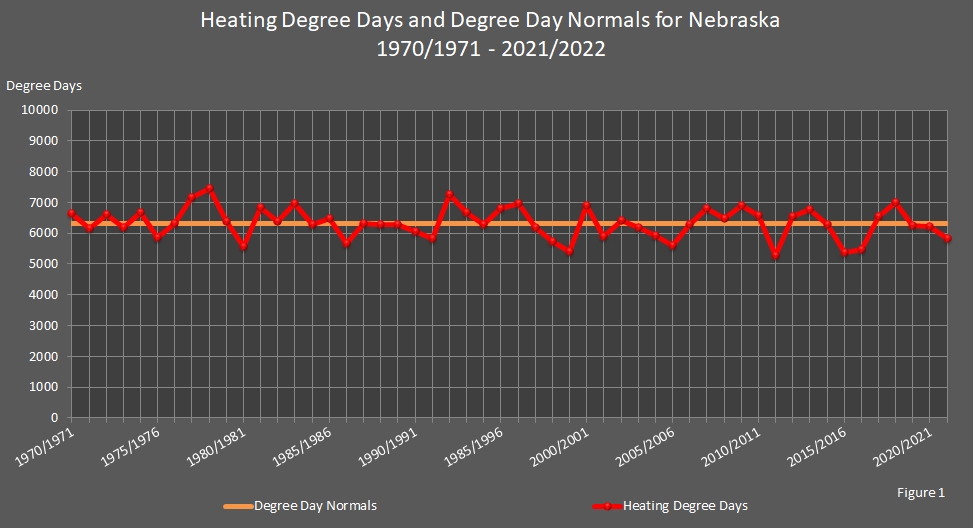
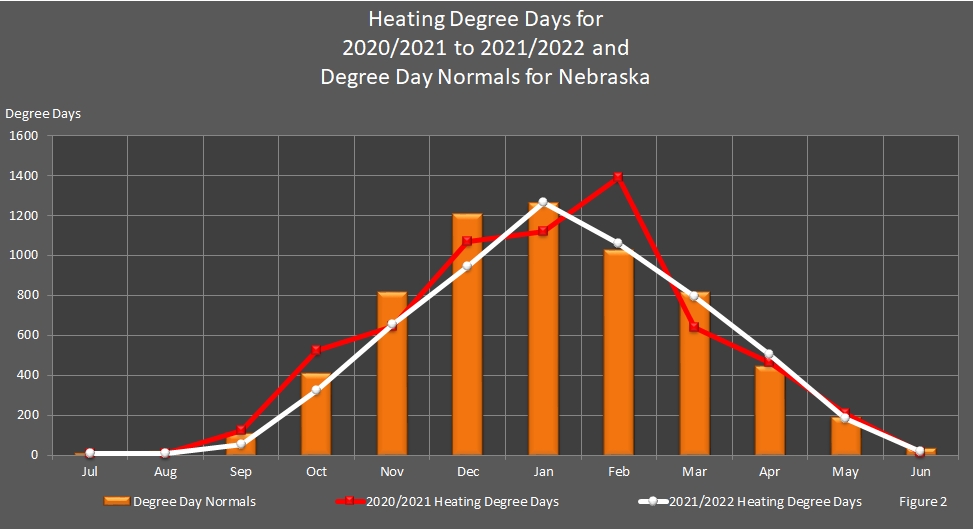
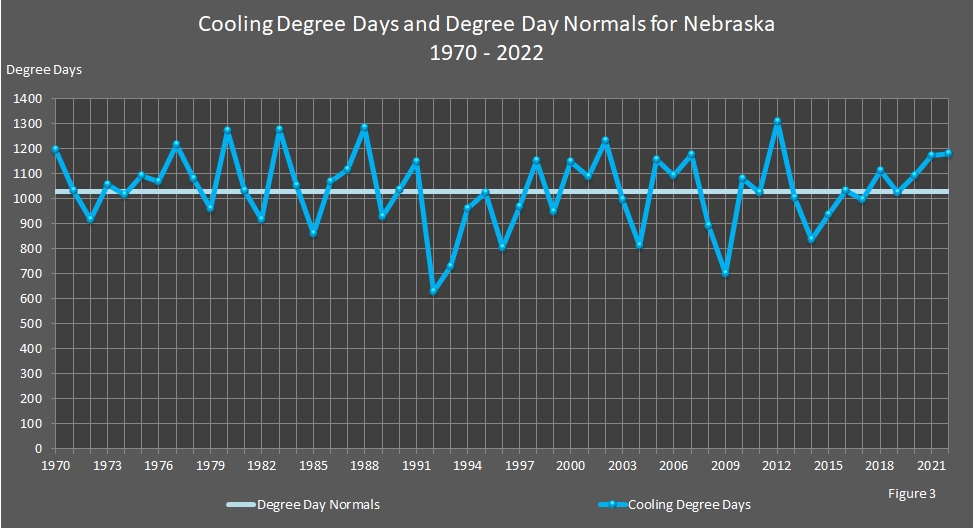
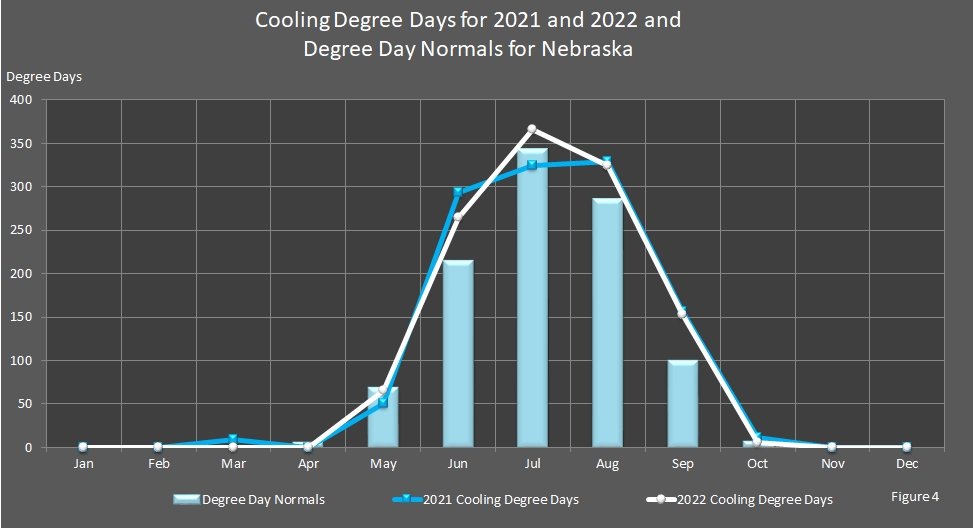
In the tables below, Nebraska's heating and cooling degree days are listed as well as degree day normals. Figures 1 and 3 compare over fifty years of degree days to the degree day normals, and Figures 2 and 4 compare the last two years of monthly degree days to monthly degree day normals for the state.

Degree Day Normals

Degree day normals are thirty–year averages over a baseline comparison period. The current thirty–year period used for degree–day normals is 1981–2010. The average number of heating and cooling degree days, or the degree day normals, for each month and a total for the year is listed in the first row of each table below.

Nebraska's heating degree day normal for a year is 6322 and cooling degree day normal for a year is 1027. In a year with normal weather, Nebraskans will heat their homes and businesses 6322 degree days and cool their homes and businesses 1027 degree days. In comparison, Hawaii's (a hot weather state) heating degree day normal is 1 and Hawaii's cooling degree day normal is 3954, and Colorado's (a cold weather state) heating degree day normal is 8304 and Colorado's cooling degree day normal is 366.

In the 2021/2022 season, Nebraska's heating degree days totaled 5813 or 509 degree days less than the degree day normal. This indicates Nebraska's winter was 8.1 percent warmer than normal. In 2022, Nebraska's cooling degree days totaled 1181 or 154 degree days more than the degree day normal. This indicates Nebraska's summer was 15.0 percent warmer than normal. Comparison can also be made between degree day normals and degree days using individual months.

Heating Degree Days

Heating degree days measure how cold Nebraska is over a period of time relative to a base temperature (most commonly 65 degrees Fahrenheit). Heating degree days are used as an indicator of space heating energy requirements.

According to Figure 1 and the data table below, in over fifty years, 2011/2012 was the warmest year with 5286 heating degree days, and 1978/1979 was the coldest year with 7440 heating degree days. Figure 1 compares Nebraska's heating degree days each year (the red line) to what is considered normal (the orange line).

Return to top of page

chart showing Annual Heating Degree Days and Degree Day Normals for Nebraska.

Return to top of page

Figure 2 compares heating degree days with the degree day normals for each month during the most recent year that data is available and the prior year. Heating degree days are usually found during the heating season, or winter, but there can be heating degree days during the fall and spring, too. Zero (0) heating degree days for any month indicate that temperatures reached levels that homes and businesses required minimal or no heating.

In 2021/2022, the heating degree days reported for January through September were close to the heating degree day normals for each month with the exception of October through December. The total heating degree days for 2021/2022 indicated 8.1 percent warmer–than–normal winter weather.

In 2021/2022, October was 21 percent warmer than normal (requiring less heating) with 322 heating degree days versus 406 degree day normals. November was 19 percent warmer than normal, and December was 22 percent warmer than normal.

Return to top of page

chart showing Monthly Heating Degree Days and Degree Day Normals for Nebraska.

Return to top of page

December and January are normally the peak of winter in Nebraska. In other words, December and January usually have the most heating degree days. In the winter of 2021/2022, the peak of winter was in January and February. In 2020/2021, Nebraska also had the most heating degree days in January and February, as observed in Figure 2.

Data in the table below shows that the number of heating degree days in February 2021 (1391) was 367 degree days above normal (1024). In other words, the weather was colder than usual, and Nebraska consumers heated their homes and businesses 36 percent more than they would in a February with normal winter weather.

Return to top of page

Heating Degree Days and Degree Day Normals for Nebraska
1969/1970 – 2022/2023

Season Jul Aug Sep Oct Nov Dec Jan Feb Mar Apr May Jun Total
Normal 10 17 107 406 812 1205 1260 1024 813 443 190 35 6322
Season Jul Aug Sep Oct Nov Dec Jan Feb Mar Apr May Jun Total
2022/2023 6 7 54 367 859 1277 NA NA NA NA NA NA NA
2021/2022 9 7 52 322 655 943 1266 1060 795 503 184 17 5813
2020/2021 7 10 122 525 645 1068 1118 1391 637 462 207 12 6204
2019/2020 8 17 35 567 871 1059 1211 979 717 515 247 10 6236
2018/2019 12 18 71 503 957 1126 1233 1344 999 417 284 36 7000
2017/2018 5 37 71 379 759 1177 1333 1205 797 688 95 13 6559
2016/2017 4 1 35 232 599 1225 1199 789 713 428 220 19 5464
2015/2016 4 13 31 308 672 1030 1235 890 620 397 188 1 5389
2014/2015 26 15 120 344 968 1103 1180 1178 702 396 237 30 6299
2013/2014 13 10 45 432 848 1314 1291 1219 916 451 188 33 6761
2012/2013 0 13 105 486 723 1143 1234 1010 953 617 210 34 6528
2011/2012 0 11 167 336 771 1111 1060 988 406 307 115 14 5286
2010/2011 8 6 98 313 803 1239 1441 1100 839 466 226 35 6574
2009/2010 30 30 134 640 639 1421 1433 1206 773 330 236 25 6897
2008/2009 8 18 122 407 772 1354 1277 941 834 518 182 47 6480
2007/2008 6 2 90 310 760 1338 1386 1154 872 593 245 36 6792
2006/2007 0 12 172 482 781 1033 1330 1208 612 509 124 30 6293
2005/2006 1 13 47 356 698 1255 882 1018 845 316 151 16 5598
2004/2005 20 38 52 357 736 1086 1360 879 782 385 199 21 5915
2003/2004 5 5 150 320 866 1065 1338 1135 677 391 163 64 6179
2002/2003 0 11 81 586 840 1035 1249 1133 803 391 234 56 6419
2001/2002 1 9 109 398 540 1041 1094 981 1062 405 244 8 5892
2000/2001 8 1 80 325 1038 1505 1206 1226 933 375 165 37 6899
1999/2000 0 18 140 393 565 1021 1143 833 686 439 128 40 5406
1998/1999 5 9 32 343 690 1075 1267 806 806 464 193 51 5741
1997/1998 6 19 78 371 888 1098 1220 822 1031 470 119 61 6183
1996/1997 17 21 148 379 1013 1329 1386 1001 743 616 281 26 6960
1995/1996 3 1 135 412 889 1149 1432 994 1030 490 248 26 6809
1994/1995 21 19 83 343 751 1131 1284 894 833 571 324 45 6299
1993/1994 15 15 202 449 944 1083 1390 1241 731 457 139 18 6684
1992/1993 36 52 118 402 946 1231 1458 1267 922 548 217 62 7259
1991/1992 7 11 90 435 1043 1033 1009 790 696 473 182 68 5837
1990/1991 12 10 51 402 697 1347 1449 816 736 379 132 15 6046
1989/1990 2 14 140 376 835 1432 1008 974 751 465 257 19 6273
1988/1989 7 2 91 485 766 1054 1034 1350 892 357 184 58 6280
1987/1988 1 24 111 518 695 1080 1433 1120 772 451 107 4 6316
1986/1987 1 33 86 401 901 1090 1109 795 785 346 106 17 5670
1985/1986 8 31 142 415 1117 1411 1021 1089 645 398 174 15 6466
1984/1985 8 1 146 416 770 1175 1407 1154 701 326 129 56 6289
1983/1984 1 0 64 370 785 1758 1304 869 1009 558 227 26 6971
1982/1983 2 14 117 384 879 1090 1182 928 842 634 278 46 6396
1981/1982 6 21 94 444 693 1212 1593 1123 885 516 174 85 6846
1980/1981 0 6 73 426 696 1089 1118 947 720 229 237 19 5560
1979/1980 11 14 63 366 906 1000 1279 1164 954 418 178 19 6372
1978/1979 6 13 48 398 865 1364 1738 1390 865 491 228 34 7440
1977/1978 0 24 81 398 811 1226 1651 1394 931 425 204 26 7171
1976/1977 1 8 91 532 961 1197 1541 886 710 286 85 16 6314
1975/1976 1 2 155 302 811 1125 1261 784 817 349 226 31 5864
1974/1975 0 34 168 312 769 1157 1273 1203 1030 528 151 44 6669
1973/1974 9 0 141 299 801 1266 1441 928 709 386 160 42 6182
1972/1973 13 16 105 487 896 1370 1280 1007 712 481 232 25 6624
1971/1972 18 10 100 303 760 1136 1362 1058 725 460 187 26 6145
1970/1971 1 4 108 479 847 1129 1400 1109 906 397 241 13 6634
1969/1970 8 10 88 573 783 1244 1467 912 972 444 108 24 6633

Return to top of page

Cooling Degree Days

Cooling degree days measure how warm Nebraska is over a period of time relative to a base temperature (most commonly 65 degrees Fahrenheit). Cooling degree days are used as an indicator of air conditioning energy requirements.

According to Figure 3 and the data table below, in over fifty years, 2012 was the hottest year with 1306 cooling degree days, and 1992 was the coolest year with only 628 cooling degree days. Figure 3 compares Nebraska's cooling degree days each year (the blue line) to what is considered normal (the lighter blue line).

Return to top of page

chart showing Annual Cooling Degree Days and Degree Day Normals for Nebraska.

Return to top of page

Figure 4 compares cooling degree days with the degree day normals for each month during the most recent year that data is available and the prior year. Cooling degree days are usually found during the cooling season, or summer, but there can be cooling degree days during the fall and spring, too. With the exception of January 2006, the period from November to February of each year consistently has zero (0) cooling degree days in Nebraska. Zero (0) degree days for any month indicate that temperatures reached levels that homes and businesses required minimal or no cooling.

In 2022, the number of cooling degree days reported were relatively the same as the cooling degree day normals except from June to September. The cooling degree days reported for June were 52 percent above the cooling degree day normal (the month was 52 percent warmer than normal). July's cooling degree days were 6.4 percent warmer than normal, August's cooling degree days were 13.6 percent warmer than normal, and September's cooling degree days were 53.0 percent warmer than normal. It shows in the data table that the total for 2022 was 15.0 percent above the degree day normal so 2022 had warmer–than–normal weather.

In 2021, the cooling degree days reported were relatively the same as the cooling degree day normals except for the months of June, August, and September. The cooling degree days reported for June, August, and September were 36 percent, 15 percent, and 56 percent, respectively, higher than the cooling degree day normals (the months were warmer than normal). Looking at the data table, the total for 2021 was 14 percent above the degree day normal so 2021 had warmer–than–normal weather.

Return to top of page

chart showing Monthly Cooling Degree Days and Degree Day Normals for Nebraska.

Return to top of page

July is normally the peak of summer in Nebraska. In other words, July usually has the most cooling degree days. In 2021 and 2022, Nebraska had the most cooling degree days in August and July, respectively, as observed in Figure 4.

Data in the table below shows that the number of cooling degree days in, for example, July 2021 (324) was 20 degree days below the cooling degree day normal (344). In other words, the weather was cooler than usual, and Nebraska consumers cooled their homes and businesses 23 percent less than they would in a July with normal summer weather.

Return to top of page

Cooling Degree Days and Degree Day Normals for Nebraska
1970 – 2022

Year Jan Feb Mar Apr May Jun Jul Aug Sep Oct Nov Dec Total
Normal 0 0 1 5 69 215 344 286 100 7 0 0 1027
Year Jan Feb Mar Apr May Jun Jul Aug Sep Oct Nov Dec Total
2022 0 0 0 0 66 265 366 325 153 6 0 0 1181
2021 0 0 9 0 51 293 324 329 156 11 0 0 1173
2020 0 0 5 0 35 327 353 295 77 0 0 0 1092
2019 0 0 0 5 28 194 348 247 200 0 0 0 1022
2018 0 0 0 0 142 296 299 244 129 0 0 0 1110
2017 0 0 0 2 47 253 380 175 131 6 0 0 994
2016 0 0 0 1 28 312 314 246 126 6 0 0 1033
2015 0 0 5 6 40 202 299 205 167 10 0 0 934
2014 0 0 0 0 63 202 221 263 78 9 0 0 836
2013 0 0 0 0 48 193 291 299 170 4 0 0 1005
2012 0 0 38 13 122 273 500 269 91 0 0 0 1306
2011 0 0 0 0 46 196 438 289 45 9 0 0 1023
2010 0 0 0 12 40 227 339 351 99 12 0 0 1080
2009 0 0 0 0 65 168 209 193 67 0 0 0 702
2008 0 0 0 0 36 192 339 244 78 5 0 0 894
2007 0 0 10 0 110 204 365 369 106 13 0 0 1177
2006 1 0 0 12 87 259 405 284 44 0 0 0 1092
2005 0 0 0 7 57 253 381 284 166 8 0 0 1156
2004 0 0 6 5 77 135 246 177 159 7 0 0 812
2003 0 0 0 5 38 146 382 359 56 11 0 0 997
2002 0 0 0 4 36 332 446 296 117 0 0 0 1231
2001 0 0 0 7 79 189 404 317 87 5 0 0 1088
2000 0 0 6 0 109 187 331 381 119 16 0 0 1149
1999 0 0 0 0 60 162 409 245 64 8 0 0 948
1998 0 0 0 0 117 150 361 310 201 14 0 0 1153
1997 0 0 0 0 26 229 345 238 120 10 0 0 968
1996 0 0 0 0 35 225 253 226 57 10 0 0 806
1995 0 0 0 0 19 177 356 396 67 7 0 0 1022
1994 0 0 0 0 95 260 235 243 113 13 0 0 959
1993 0 0 0 0 45 139 258 259 29 0 0 0 730
1992 0 0 6 0 63 136 190 144 82 7 0 0 628
1991 0 0 0 7 106 291 340 291 108 5 0 0 1148
1990 0 0 0 0 32 255 292 293 158 7 0 0 1037
1989 0 0 0 8 64 151 362 269 62 10 0 0 926
1988 0 0 0 0 132 356 336 352 109 0 0 0 1285
1987 0 0 0 9 129 281 391 217 88 0 0 0 1115
1986 0 0 8 5 73 286 382 190 116 7 0 0 1067
1985 0 0 6 11 104 153 323 192 63 7 0 0 859
1984 0 0 0 0 41 238 336 367 62 7 0 0 1051
1983 0 0 0 0 28 176 426 493 140 11 0 0 1274
1982 0 0 0 0 74 116 370 265 81 10 0 0 916
1981 0 0 5 30 40 268 352 230 103 5 0 0 1033
1980 0 0 0 1 70 257 458 351 127 6 0 0 1270
1979 0 0 0 0 44 202 294 271 139 10 0 0 960
1978 0 0 0 1 53 230 346 279 165 7 0 0 1081
1977 0 0 6 17 153 273 422 220 116 7 0 0 1214
1976 0 0 0 9 43 212 372 325 107 0 0 0 1068
1975 0 0 0 0 93 180 373 371 53 20 0 0 1090
1974 0 0 5 6 81 180 497 185 46 17 0 0 1017
1973 0 0 5 0 41 240 316 369 65 20 0 0 1056
1972 0 0 1 0 62 226 280 254 93 0 0 0 916
1971 0 0 0 6 38 314 253 297 102 21 0 0 1031
1970 0 0 0 0 129 242 372 359 91 4 0 0 1197

Return to top of page

Conclusion

An increase on your utility bill could be related to an increase in degree days but, if you decide that weather had no bearing on the increase in your utility bill, other factors worth considering are changes in demand, changes in your building's structure, changes in the number of occupants, or changes in fuel prices.

Return to top of page

Sources: National Oceanic and Atmospheric Administration (NOAA), National Centers for Environmental Information, Climate at a Glance: Statewide Time Series from https://www.ncei.noaa.gov/cag/, Asheville, NC. Nebraska Department of Environment and Energy, Lincoln, NE.

Note: NA = Not Available.

This report was updated on January 26, 2023.
Typically, there is a year between updates.

Return to top of page