Nebraska Department of Environment and Energy

Air Water Land Energy

Nebraska Energy Statistics

Historical
Nebraska Ethanol Production

1985 – 2007

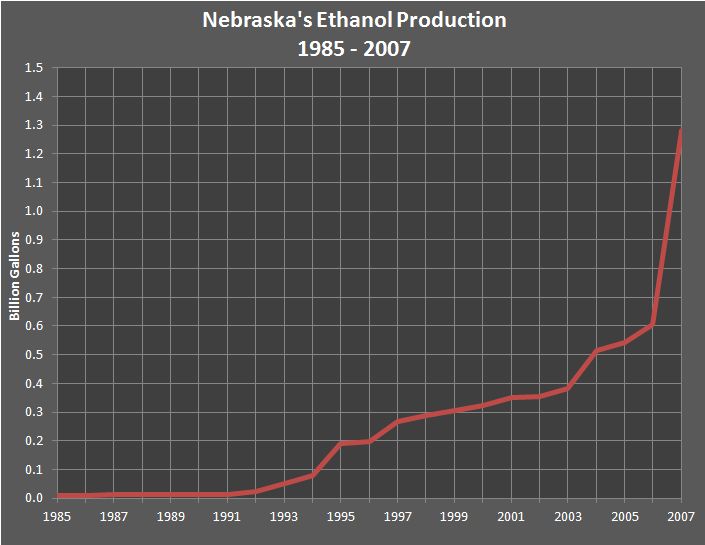
In 2007, ethanol production capacity in Nebraska doubled from the previous year to reach nearly 1.3 billion gallons due to plants completing expansion projects and plants becoming operational. In the graph below, production is shown from 1985 to 2007. The five tables at the bottom of this report show each plant's annual production or capacity from 1985 to 2007.

As of June 30, 2004, seven plants met a minimum production of 8,500 gallons over 30 days to receive state incentives. The seven plants were at Sutherland, Lexington, Norfolk, Cambridge, Madrid, McCook, and Ravenna. Following the completion of this goal, six of the plants (Sutherland is the exception) shut down to begin building a larger facility or to secure financing needed for expansion.

ADM/MCP; Ag Processing, Inc.; and Cargill production numbers are not available after 2001, because their production volume is not for public knowledge. Starting with 2004, production numbers for all plants are the number of gallons of capacity.

The ethanol section of the state energy office's energy statistics has more information.

Return to top of page

chart showing Nebraska's Ethanol Production from 1985 through 2007.

Return to top of page

Nebraska's Ethanol Production,
1985 – 2007
Table 1 of 5

(Gallons)

Year Chief
Ethanol
Fuels
(Hastings)
Archer
Daniels
Midland (ADM)
(Columbus)
Abengoa
Bioenergy
(York)
Cargill,
Inc.
(Blair)
Nebraska
Energy,
LLC
(Aurora)
Ag
Processing,
Inc. (AGP)
(Hastings)
Midwest
Renewable
Energy
(Sutherland)
2007 62,000,000 100,000,000 55,000,000 88,000,000 50,000,000 55,000,000 18,500,000
2006 62,000,000 80,000,000 55,000,000 85,000,000 50,000,000 52,000,000 18,500,000
2005 62,000,000 80,000,000 55,000,000 85,000,000 50,000,000 52,000,000 17,500,000
2004 62,000,000 80,000,000 50,000,000 83,000,000 40,000,000 52,000,000 15,000,000
2003 60,434,802 *80,000,000 *50,000,000 *83,000,000 37,500,000 *52,000,000
2002 60,711,234 *80,000,000 50,000,000 *83,000,000 33,863,000 *45,000,000
2001 62,000,000 80,000,000 37,700,892 80,000,000 34,378,000 43,750,000 14,000,000
2000 45,000,000 80,000,000 37,657,825 80,000,000 31,000,000 37,500,000 10,000,000
1999 43,150,000 78,675,000 36,385,735 80,400,000 29,000,000 35,875,000 1,755,000
1998 42,265,000 76,490,000 31,537,922 77,125,000 29,000,000 30,090,000
1997 34,860,000 71,450,000 31,875,000 77,150,000 26,000,000 26,450,000
1996 31,650,000 46,150,000 16,300,000 56,285,000 25,000,000 22,750,000
1995 28,695,000 74,550,000 28,765,000 57,600,000 1,550,000
1994 24,675,000 54,275,000
1993 18,025,000 33,600,000
1992 13,200,000 9,850,000
1991 13,050,000
1990 12,755,000
1989 12,050,000
1988 11,750,000
1987 11,600,000
1986 10,500,000
1985 8,500,000

Return to top of page

Nebraska's Ethanol Production,
1985 – 2007
Table 2 of 5

(Gallons)

Year Husker
Ag, LLC
(Plainview)
KAAPA
Ethanol, LLC
(Axtell/Minden)
Trenton
AgriProducts
(TAP) LLC
(Trenton)
Green
Plains
Renewable
Energy
(Central City)
Mid
America
Agri
Products
(Cambridge)
Cornhusker Energy
Lexington, LLC
(Lexington)
2007 26,000,000 40,000,000 45,000,000 100,000,000 0 50,000,000
2006 26,500,000 40,000,000 45,000,000 40,000,000 0 50,000,000
2005 26,500,000 40,000,000 35,000,000 40,000,000 0 0
2004 23,000,000 40,000,000 30,000,000 40,000,000 8,500 8,500
2003 19,549,766
2002
2001
2000
1999
1998
1997
1996
1995
1994
1993
1992
1991
1990
1989
1988
1987
1986
1985

Return to top of page

Nebraska's Ethanol Production,
1985 – 2007
Table 3 of 5

(Gallons)

Year Standard
Ethanol
(Madrid)
S.W.
Energy, LLC
(McCook)
Louis
Dreyfus
Commodities
(Norfolk)
Abengoa
Bioenergy
(Ravenna)
Advanced
BioEnergy
(Fairmont)
E3
BioFuels
(Mead)
2007 55,000,000 0 53,000,000 80,000,000 115,000,000 25,000,000
2006 0 0 0 0
2005 0 0 0 0
2004 8,500 8,500 8,500 8,500
2003
2002
2001
2000
1999
1998
1997
1996
1995
1994
1993
1992
1991
1990
1989
1988
1987
1986
1985

Return to top of page

Nebraska's Ethanol Production,
1985 – 2007
Table 4 of 5

(Gallons)

Year Siouxland
Ethanol,
LLC
(Jackson)
VeraSun
Ord
(Ord)
Valero
Renewable
Fuels
(Albion)
NEDAK
Ethanol
(Atkinson)
Aventine
Aurora
West
LLC
(Aurora)
E–Energy
Adams
(Adams)
2007 55,000,000 50,000,000 110,000,000 50,000,000
2006
2005
2004
2003
2002
2001
2000
1999
1998
1997
1996
1995
1994
1993
1992
1991
1990
1989
1988
1987
1986
1985

Return to top of page

Nebraska's Ethanol Production,
1985 – 2007
Table 5 of 5

(Gallons)

Year ALTRA
Nebraska,
LLC
(Carleton)
Pioneer
Trail
(Wood River)
Bridgeport
Ethanol
(Bridgeport)
Annual
Total
(Gallons)
2007 1,282,500,000
2006 604,000,000
2005 543,000,000
2004 515,051,000
2003 382,484,568
2002 352,574,234
2001 351,828,892
2000 321,157,825
1999 305,240,735
1998 286,507,922
1997 267,785,000
1996 198,135,000
1995 191,160,000
1994 78,950,000
1993 51,625,000
1992 23,050,000
1991 13,050,000
1990 12,755,000
1989 12,050,000
1988 11,750,000
1987 11,600,000
1986 10,500,000
1985 8,500,000

Return to top of page

Sources: Nebraska Ethanol Board, Lincoln, NE. Nebraska Energy Office, Lincoln, NE.

Note: An asterisk (*) indicates an estimate.

These tables restructured February 5, 2014.

Return to top of page