Nebraska Department of Environment and Energy

Air Water Land Energy

Nebraska Energy Statistics

Annual Market Share of Ethanol–Blended Fuel
in Nebraska

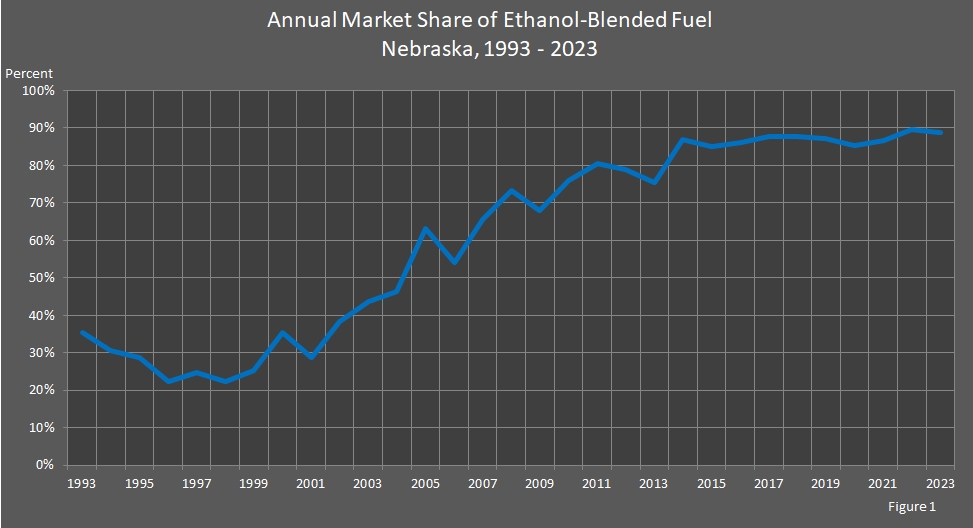
In Nebraska, most ethanol is sold in a blended fuel—10 percent ethanol with 90 percent gasoline (called E–10) or 85 percent ethanol with 15 percent gasoline (called E85). Of the total gasoline and ethanol–blended fuel sold in the state in 2023, 88.8 percent was an ethanol blend. In Figure 1 and the data table below, the market share of ethanol–blended fuel is shown.

Monthly averages are available. The ethanol section of the Nebraska Energy Office's Energy Statistics has more information.

Return to top of page

line chart showing Market Share of Ethanol-Blended Fuel in Nebraska.

Return to top of page

Market Share of
Ethanol–Blended Fuel
in Nebraska
1993 – 2023

Year Ethanol–Blend
(Gallons)
Gasoline
(Gallons)
Annual Total
(Gallons)
Ethanol–Blend
Market Share
(Percent)
2023 816,583,000 102,733,157 919,316,157 88.8%
2022 813,496,964 94,125,248 907,622,212 89.6%
2021 792,358,111 121,235,531 913,593,642 86.7%
2020 723,625,085 124,627,390 848,252,475 85.3%
2019 803,364,733 118,846,020 922,210,753 87.1%
2018 801,220,953 111,278,739 912,499,692 87.8%
2017 796,139,159 113,093,475 909,232,634 87.6%
2016 780,181,844 126,958,423 907,140,267 86.0%
2015 747,720,178 131,581,053 879,301,231 85.0%
2014 764,972,524 114,671,991 879,644,515 87.0%
2013 634,703,226 207,468,572 842,171,498 75.4%
2012 655,352,915 176,347,231 831,700,146 78.8%
2011 662,948,096 159,717,125 822,665,221 80.6%
2010 641,512,693 202,737,874 844,250,567 76.0%
2009 556,777,551 261,216,313 817,993,864 68.1%
2008 603,876,294 221,355,779 825,232,073 73.2%
2007 543,155,418 285,501,195 828,656,613 65.5%
2006 440,640,431 375,010,121 815,650,552 54.0%
2005 519,378,181 302,704,444 822,082,625 63.2%
2004 389,692,366 452,232,622 841,924,988 46.3%
2003 369,010,649 478,050,712 847,061,361 43.6%
2002 325,265,186 525,090,650 850,355,836 38.3%
2001 238,263,262 591,695,432 829,958,694 28.7%
2000 295,453,347 541,400,519 836,853,866 35.3%
1999 213,678,714 632,032,642 845,711,356 25.3%
1998 189,956,805 661,061,910 851,018,715 22.3%
1997 206,250,862 629,887,065 836,137,927 24.7%
1996 183,903,344 636,785,443 820,688,787 22.4%
1995 238,027,521 587,503,297 825,530,818 28.8%
1994 230,802,731 525,261,561 756,064,292 30.5%
1993 278,960,759 508,730,756 787,691,515 35.4%

Return to top of page

Sources: "Monthly Motor–Fuel Consumption." Nebraska Department of Revenue, Motor Fuels Division, Lincoln, NE. Nebraska Department of Environment and Energy, Lincoln, NE.

Notes: The gasoline numbers are net volume numbers which exclude motor fuel for aviation use, non–highway agricultural use, and industrial use. NA indicates data is not available. Numbers in red have been revised.

The table and graph were revised on March 14, 2024.
Typically, there is one year between updates.

Return to top of page