Nebraska Department of Environment and Energy

Air Water Land Energy

Nebraska Energy Statistics

Generating Units and Capacity
in Nebraska
by Energy Source and Year of Initial Operation

This report shows the new generation that became commercially operable from 1915 to 1940 and then during each decade since then. Details about the generation includes energy source, number of units/wind turbines, the nameplate capacity, the summer capacity, and the winter capacity.

From 1915 to 1970, an increasing number of new units were brought on line each ten–year period.

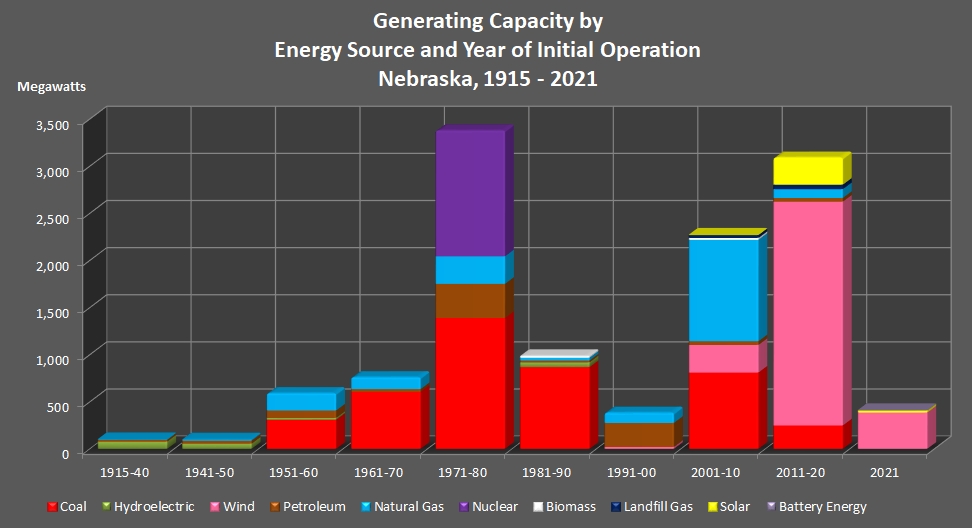
A record of 73 units started up in the period of 1951–1960. With half as many new units (37) than 1951–1960, the 1971–1980 period had the biggest increase in capacity (3,379.7 megawatts). Nuclear power accounted for almost half of the capacity added that period. Also, all nuclear power was started up in that period.

Also see the Units and Capacity by Energy Source report and the Generating Units report for additional information.

A Note About Nameplate Capacity

Summer capacity and winter capacity is sometimes greater than nameplate capacity. The nameplate gives the capacity rating of the generator when it operates at certain temperatures, pressures, and power factors. With some modifications and with some margins that are built into generators, it is possible to exceed its nameplate. It is not uncommon for a generator to exceed its nameplate. The nameplate is usually not replaced and, in this case, the summer and winter capacity is often much higher than the nameplate value. Normally, you expect summer and winter capacity to be below nameplate capacity and in most cases they are.

Return to top of page

bar chart showing Generating Capacity by Energy Source and Year of Initial Operation in Nebraska.

Return to top of page

Number of Units and Generating Capacity by
Energy Source and Year of Initial Operation
Nebraska, 1915 – 2021

Detail Period: 2021

Period Inclusive of
Year of
Initial Operation
Primary
Energy Source
Number
of Units
Number of
Wind Turbines
Generator
Nameplate
Capacity

[Megawatts (MW)]
Net Summer
Capacity

(MW)
Net Winter
Capacity

(MW)
2021
Biomass 0 NA 0.00 0.00 0.00
Battery Storage 2 NA 1.40 1.40 1.40
Coal 0 NA 0.00 0.00 0.00
Landfill Gas 0 NA 0.00 0.00 0.00
Natural Gas 0 NA 0.00 0.00 0.00
Petroleum 0 NA 0.00 0.00 0.00
Solar 4 NA 4.40 4.40 4.40
Wind 117 117 385.70 385.70 385.70
Total 121 117 391.50 391.50 391.50

Return to top of page

Detail Period: 2011 – 2020

Period Inclusive of
Year of
Initial Operation
Primary
Energy Source
Number
of Units
Number of
Wind Turbines
Generator
Nameplate
Capacity

[Megawatts (MW)]
Net Summer
Capacity

(MW)
Net Winter
Capacity

(MW)
2011–2020
Biomass 0 NA 0.00 0.00 0.00
Battery Storage 1 NA 1.50 1.50 1.50
Coal 1 NA 248.00 232.00 232.00
Landfill Gas 3 NA 4.80 4.80 4.80
Natural Gas 1 NA 9.30 9.30 9.30
Petroleum 2 NA 4.00 4.00 4.00
Solar 9 NA 28.80 27.70 25.70
Wind 1,111 1,111 2,374.00 2,368.10 2,368.10
Total 1,128 1,111 2,670.40 2,647.40 2,615.40

Return to top of page

Detail Period: 2001 – 2010

Period Inclusive of
Year of
Initial Operation
Primary
Energy Source
Number
of Units
Number of
Wind Turbines
Generator
Nameplate
Capacity

[Megawatts (MW)]
Net Summer
Capacity

(MW)
Net Winter
Capacity

(MW)
2001–2010
Biomass 2 NA 1.0800 1.0770 1.0770
Coal 2 NA 809.4000 743.2000 743.2000
Landfill Gas 8 NA 6.4000 6.4000 6.4000
Natural Gas 13 NA 1,075.5000 922.6000 870.8000
Petroleum 7 NA 10.5000 9.9000 9.9000
Solar 3 NA 0.0524 0.0524 0.0524
Wind 172 172 292.5920 234.6920 251.1920
Total 207 172 2,195.5244 1,917.9214 1,882.6214

Return to top of page

Detail Period: 1991 – 2000

Period Inclusive of
Year of
Initial Operation
Primary
Energy Source
Number
of Units
Number of
Wind Turbines
Generator
Nameplate
Capacity

[Megawatts (MW)]
Net Summer
Capacity

(MW)
Net Winter
Capacity

(MW)
1991–2000
Natural Gas 5 NA 109.8 96.1 107.3
Petroleum 17 NA 255.5 231.1 255.6
Wind 4 4 3.0 3.0 3.0
Total 26 4 368.3 330.2 365.9

Return to top of page

Detail Period: 1981 – 1990

Period Inclusive of
Year of
Initial Operation
Primary
Energy Source
Number
of Units
Number of
Wind Turbines
Generator
Nameplate
Capacity

[Megawatts (MW)]
Net Summer
Capacity

(MW)
Net Winter
Capacity

(MW)
1981–1990
Biomass 5 NA 3.5 3.5 0.0
Coal 3 NA 867.4 877.0 877.0
Hydroelectric 1 NA 50.0 38.0 38.0
Natural Gas 3 NA 14.0 13.5 14.1
Petroleum 4 NA 3.6 3.2 3.2
Total 16 NA 938.5 935.2 932.3

Return to top of page

Detail Period: 1971 – 1980

Period Inclusive of
Year of
Initial Operation
Primary
Energy Source
Number
of Units
Number of
Wind Turbines
Generator
Nameplate
Capacity

[Megawatts (MW)]
Net Summer
Capacity

(MW)
Net Winter
Capacity

(MW)
1971–1980
Coal 3 NA 1,388.7 1,368.8 1,369.6
Natural Gas 21 NA 291.7 282.8 297.2
Petroleum 11 NA 361.7 320.0 366.9
Uranium 2 NA 1,337.6 1,245.0 1,261.0
Total 37 NA 3,379.7 3,216.6 3,294.7

Return to top of page

Detail Period: 1961 – 1970

Period Inclusive of
Year of
Initial Operation
Primary
Energy Source
Number
of Units
Number of
Wind Turbines
Generator
Nameplate
Capacity

[Megawatts (MW)]
Net Summer
Capacity

(MW)
Net Winter
Capacity

(MW)
1961–1970
Coal 5 NA 604.3 607.2 533.2
Natural Gas 34 NA 127.0 120.3 122.2
Petroleum 11 NA 19.1 17.9 17.9
Total 50 NA 750.4 745.4 673.3

Return to top of page

Detail Period: 1951 – 1960

Period Inclusive of
Year of
Initial Operation
Primary
Energy Source
Number
of Units
Number of
Wind Turbines
Generator
Nameplate
Capacity

[Megawatts (MW)]
Net Summer
Capacity

(MW)
Net Winter
Capacity

(MW)
1951–1960
Coal 4 NA 307.6 315.6 261.2
Hydroelectric 2 NA 1.7 1.1 1.1
Natural Gas 32 NA 184.7 184.7 185.8
Petroleum 35 NA 32.1 27.4 27.8
Total 73 NA 526.1 528.8 475.9

Return to top of page

Detail Period: 1941 – 1950

Period Inclusive of
Year of
Initial Operation
Primary
Energy Source
Number
of Units
Number of
Wind Turbines
Generator
Nameplate
Capacity

[Megawatts (MW)]
Net Summer
Capacity

(MW)
Net Winter
Capacity

(MW)
1941–1950
Hydroelectric 5 NA 55.0 54.0 54.0
Natural Gas 10 NA 14.3 12.3 12.9
Petroleum 22 NA 9.6 8.4 8.4
Total 37 NA 78.9 74.7 75.3

Return to top of page

Detail Period: 1915 – 1940

Period Inclusive of
Year of
Initial Operation
Primary
Energy Source
Number
of Units
Number of
Wind Turbines
Generator
Nameplate
Capacity

[Megawatts (MW)]
Net Summer
Capacity

(MW)
Net Winter
Capacity

(MW)
1915–1940
Hydroelectric 11 NA 76.2 73.3 72.6
Natural Gas 3 NA 3.4 3.3 3.3
Petroleum 15 NA 5.8 5.4 5.5
Total 29 NA 85.4 82.0 81.4

Return to top of page

Sources: Energy Information Administration, Washington, DC. Nebraska Department of Environment and Energy, Lincoln, NE.

Note: NA indicates not applicable.

The table and graph were updated on December 28, 2022.
Typically, there is one year between updates.

Return to top of page