Nebraska Department of Environment and Energy

Air Water Land Energy

Nebraska Energy Statistics

Nebraska's Petroleum
Average Annual Prices
by Product

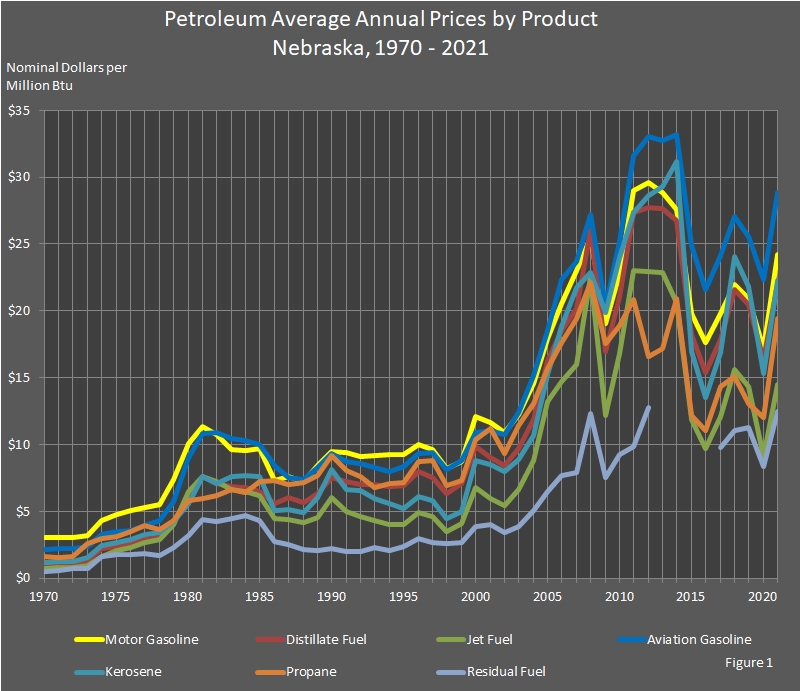
Aviation gasoline ($28.86) had the highest price among the petroleum products in 2021, followed by motor gasoline ($24.22), kerosene ($22.28), distillate fuel ($22.02), propane ($19.45), jet fuel ($14.48), and residual fuel ($12.47).

From 2020 to 2021, propane increased 62.4 percent, jet fuel increased 59.1 percent, residual fuel increased 49.5 percent, kerosene increased 45.7 percent, motor gasoline increased 41.2 percent, distillate fuel increased 34.8 percent, and aviation gasoline increased 29.2 percent.

The prices in the table and graph below are in nominal dollars per million Btu to make a comparison easier among the petroleum products.

Return to top of page

chart showing Petroleum Average Annual Prices by Product in Nebraska.

Return to top of page

Nebraska Petroleum
Average Annual Prices by Product
2010 – 2021

(Nominal Dollars per Million Btu)

Year Aviation
Gasoline
Distillate
Fuel
Jet Fuel Kerosene Motor
Gasoline
Propane Residual
Fuel
2021 $28.86 $22.02 $14.48 $22.28 $24.22 $19.45 $12.47
2020 $22.34 $16.33 $9.10 $15.29 $17.15 $11.98 $8.34
2019 $25.57 $20.45 $14.37 $21.80 $20.90 $13.04 $11.27
2018 $27.04 $21.60 $15.64 $24.03 $21.93 $15.07 $11.07
2017 $24.13 $17.87 $12.10 $16.89 $19.78 $14.37 $9.75
2016 $21.62 $15.37 $9.72 $13.52 $17.62 $11.02 $0.00
2015 $24.86 $18.24 $11.88 $16.95 $19.80 $19.82 $0.00
2014 $33.16 $26.74 $20.59 $31.19 $27.59 $27.06 $15.88
2013 $32.71 $27.62 $22.89 $29.30 $28.85 $23.43 $0.0
2012 $33.04 $27.72 $22.97 $28.59 $29.59 $21.67 $12.73
2011 $31.64 $27.31 $23.03 $27.37 $28.96 $23.86 $9.86
2010 $25.19 $21.07 $16.78 $24.02 $22.74 $19.50 $9.21

Return to top of page

Nebraska Petroleum
Average Annual Prices by Product
1990 – 2009

(Nominal Dollars per Million Btu)

Year Aviation
Gasoline
Distillate
Fuel
Jet Fuel Kerosene Motor
Gasoline
Propane Residual
Fuel
2009 $20.32 $16.92 $12.20 $19.87 $19.00 $17.58 $7.54
2008 $27.23 $26.10 $22.56 $22.86 $25.38 $22.13 $12.28
2007 $23.70 $20.19 $16.00 $21.73 $22.94 $19.44 $7.90
2006 $22.31 $18.54 $14.70 $18.82 $20.49 $17.61 $7.71
2005 $18.56 $16.28 $13.19 $15.25 $17.92 $15.69 $6.46
2004 $15.13 $11.90 $8.77 $10.70 $14.58 $13.05 $5.02
2003 $12.42 $9.66 $6.59 $8.90 $12.24 $11.45 $3.87
2002 $10.72 $8.40 $5.44 $7.95 $10.88 $9.32 $3.40
2001 $11.01 $9.03 $5.94 $8.53 $11.58 $11.16 $4.04
2000 $10.87 $9.82 $6.76 $8.76 $12.07 $10.34 $3.88
1999 $8.81 $7.09 $4.08 $4.97 $8.72 $7.28 $2.65
1998 $8.11 $6.36 $3.49 $4.46 $8.19 $6.92 $2.55
1997 $9.39 $7.56 $4.59 $5.84 $9.62 $8.78 $2.65
1996 $9.29 $8.00 $4.89 $6.07 $10.02 $8.75 $2.94
1995 $8.36 $6.91 $4.01 $5.20 $9.21 $7.13 $2.38
1994 $7.96 $6.86 $3.99 $5.60 $9.21 $7.07 $2.08
1993 $8.24 $6.99 $4.33 $5.95 $9.11 $6.81 $2.27
1992 $8.54 $7.03 $4.64 $6.57 $9.09 $7.57 $1.97
1991 $8.71 $7.19 $5.01 $6.61 $9.43 $8.08 $2.02
1990 $9.32 $7.51 $6.03 $8.12 $9.49 $9.17 $2.22

Return to top of page

Nebraska Petroleum
Average Annual Prices by Product
1970 – 1989

(Nominal Dollars per Million Btu)

Year Aviation
Gasoline
Distillate
Fuel
Jet Fuel Kerosene Motor
Gasoline
Propane Residual
Fuel
1989 $8.28 $6.31 $4.54 $6.06 $8.42 $7.65 $2.04
1988 $7.41 $5.62 $4.14 $4.91 $7.22 $7.12 $2.17
1987 $7.55 $6.03 $4.38 $5.14 $7.58 $6.98 $2.53
1986 $8.41 $5.61 $4.43 $5.05 $7.28 $7.30 $2.71
1985 $9.99 $6.51 $6.19 $7.60 $9.67 $7.22 $4.28
1984 $10.27 $6.79 $6.50 $7.69 $9.55 $6.38 $4.65
1983 $10.44 $6.82 $6.63 $7.58 $9.61 $6.62 $4.46
1982 $10.92 $7.07 $7.19 $7.05 $10.71 $6.21 $4.22
1981 $10.84 $7.60 $7.60 $7.57 $11.37 $5.94 $4.38
1980 $9.02 $6.24 $6.47 $5.56 $10.06 $5.78 $3.21
1979 $5.73 $4.24 $4.03 $4.24 $7.41 $4.33 $2.26
1978 $4.29 $3.06 $2.90 $3.44 $5.50 $3.67 $1.70
1977 $3.97 $2.92 $2.69 $3.23 $5.29 $3.94 $1.86
1976 $3.59 $2.61 $2.26 $2.88 $5.06 $3.50 $1.76
1975 $3.45 $2.38 $2.09 $2.63 $4.76 $3.14 $1.74
1974 $3.23 $2.20 $1.60 $2.42 $4.27 $2.99 $1.62
1973 $2.36 $1.28 $0.93 $1.51 $3.21 $2.61 $0.70
1972 $2.19 $1.01 $0.78 $1.23 $3.00 $1.61 $0.71
1971 $2.21 $0.99 $0.78 $1.21 $3.00 $1.55 $0.60
1970 $2.17 $0.95 $0.75 $1.18 $3.03 $1.59 $0.48

Return to top of page

Sources: State Energy Price and Expenditure Report. Energy Information Administration, Washington, DC. Nebraska Department of Environment and Energy, Lincoln, NE.

The table and graph were updated on January 9, 2024.
Typically, there are one to two years between updates.

Return to top of page