Nebraska Department of Environment and Energy

Air Water Land Energy

Nebraska Energy Statistics

Energy Consumption in
Nebraska's Transportation Sector

The transportation sector consists of private and public vehicles that move people and commodities. Included are automobiles, trucks, buses, motorcycles, railroads, aircraft, ships, barges, and natural gas pipelines. Natural gas use reflects the fuel needed to move natural gas through a pipeline to end users in the residential, commercial, industrial, and electric power sectors. Since 1990, natural gas consumption also includes natural gas consumed as vehicle fuel.

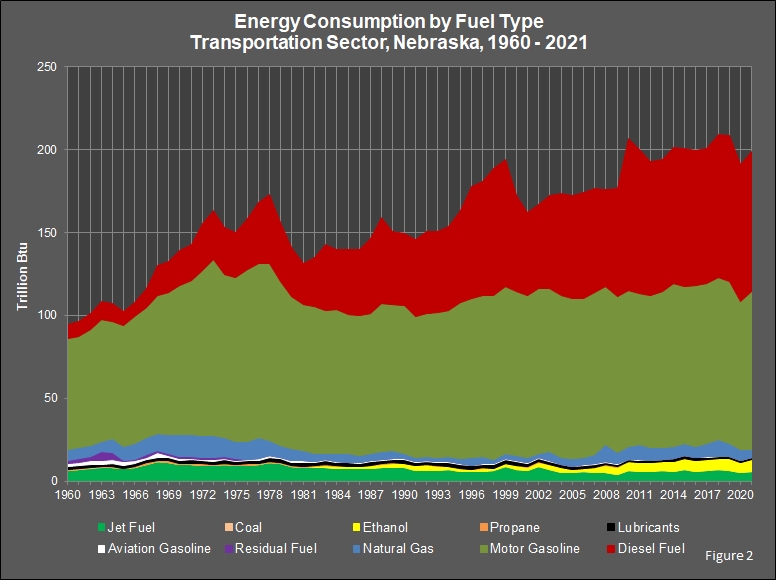
Between 2020 and 2021, transportation sector energy use increased 4.8 percent to 200.4 trillion British thermal units (Btu). Renewable energy use increased 8.2 percent, and petroleum use increased 5.4 percent from 2020. (Renewable energy consisted of ethanol.) Natural gas use decreased 34.2 percent. If there was any consumption of coal, electricity, or residual fuel in 2021, the amounts were so small that the numbers rounded to zero in this table.

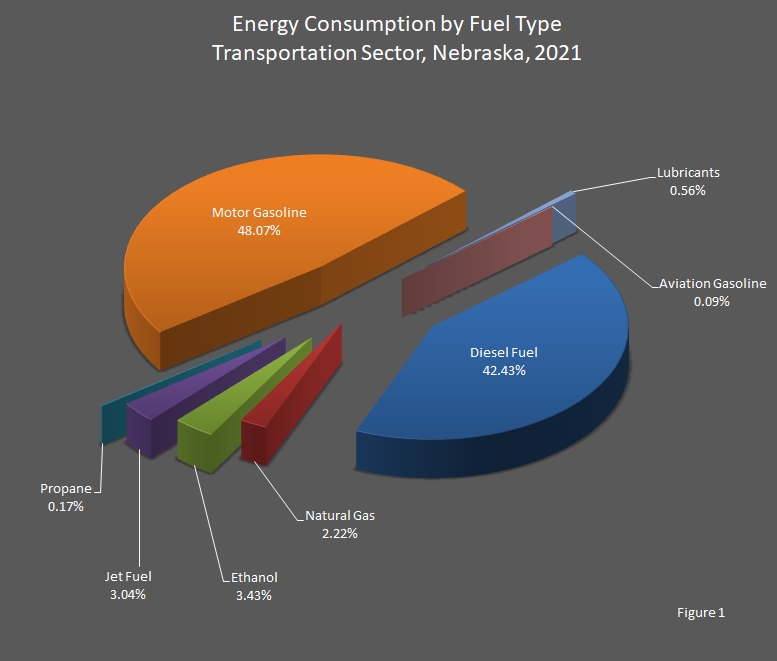
In 2021, nearly all of the transportation sector energy needs were met by petroleum products (94 percent). Ethanol met 3.4 percent, and natural gas met 2.2 percent of the energy consumed in the transportation sector.

Motor gasoline (51 percent), diesel fuel (45 percent), and jet fuel (3.2 percent) made up the majority of the petroleum products consumed by the transportation sector; each of the rest of the petroleum products comprised 1 percent or less of total petroleum products.

Return to top of page

pie chart graphic showing Energy Consumption by Fuel Type in the Transportation Sector in Nebraska.

Return to top of page

graphic showing Energy Consumption by Fuel Type in the Transportation Sector in Nebraska.

Return to top of page

Energy Consumption by Fuel Type, Transportation Sector, Nebraska,
2020 – 2021

[Trillion British Thermal Units (Btu)]

Year Coal Electricity Natural
Gas
Petroleum Renewable Total
Energy
Consumption
Aviation
Gasoline
Diesel
Fuel
Jet
Fuel
Lubri­cants Motor
Gasoline
Propane Residual
Fuel
Fuel
Ethanol
2021 0.000 0.000 4.419 0.175 84.425 6.057 1.118 95.648 0.330 0.000 6.825 200.433
2020 0.000 0.000 6.720 0.179 83.008 4.917 1.088 89.015 0.018 0.000 6.306 191.251

Return to top of page

Energy Consumption by Fuel Type, Transportation Sector, Nebraska,
2000 – 2019

[Trillion British Thermal Units (Btu)]

Year Coal Electricity Natural
Gas
Petroleum Renewable Total
Energy
Consumption
Aviation
Gasoline
Diesel
Fuel
Jet
Fuel
Lubri­cants Motor
Gasoline
Propane Residual
Fuel
Fuel
Ethanol
2019 0.000 0.000 7.595 0.187 88.410 6.565 1.187 97.738 0.123 0.000 6.945 208.750
2018 0.000 0.000 9.996 0.190 86.784 4.539 1.214 97.553 0.067 0.000 6.823 207.165
2017 0.000 0.000 7.835 0.196 81.386 4.191 1.249 96.832 0.011 0.000 6.834 202.263
2016 0.000 0.000 6.812 0.184 80.940 3.421 1.364 97.267 0.023 0.000 6.771 200.878
2015 0.000 0.000 7.519 0.170 83.301 4.246 1.818 94.800 0.258 0.000 6.660 201.004
2014 0.000 0.000 7.453 0.194 81.986 3.272 1.669 98.058 0.479 0.000 6.154 202.110
2013 0.000 0.000 7.250 0.174 79.569 3.982 1.600 94.189 0.458 0.000 5.398 194.708
2012 0.000 0.000 7.783 0.222 81.136 3.256 1.512 91.595 0.130 0.000 5.444 192.934
2011 0.000 0.000 9.410 0.234 86.991 3.378 1.644 90.873 0.126 0.000 5.442 199.402
2010 0.000 0.000 7.389 0.249 91.416 3.428 1.733 94.638 0.168 0.000 5.403 205.674
2009 0.000 0.000 7.064 0.319 65.556 3.950 1.559 93.894 0.083 0.000 4.521 176.947
2008 0.000 0.000 10.063 0.334 58.425 5.036 1.734 96.099 0.110 0.000 4.636 176.437
2007 0.000 0.000 5.498 0.401 62.661 5.489 1.868 97.957 0.148 0.000 2.571 176.593
2006 0.000 0.000 4.587 0.405 64.042 6.013 1.809 96.069 0.131 0.000 1.386 174.442
2005 0.000 0.000 4.500 0.416 62.478 5.297 1.857 96.678 0.088 0.000 1.419 172.733
2004 0.000 0.000 4.083 0.283 61.605 5.206 1.867 97.781 0.204 0.000 2.769 173.798
2003 0.000 0.000 5.410 0.409 56.449 6.834 1.842 98.441 0.171 0.000 2.974 172.531
2002 0.000 0.000 2.677 0.469 50.735 8.656 1.993 99.868 0.158 0.000 2.731 167.286
2001 0.000 0.000 3.116 0.435 50.341 6.312 2.017 98.110 0.118 0.000 2.161 162.610
2000 0.000 0.000 3.193 0.321 58.093 6.981 2.201 99.272 0.098 0.000 2.626 172.786

Return to top of page

Energy Consumption by Fuel Type, Transportation Sector, Nebraska,
1980 – 1999

[Trillion British Thermal Units (Btu)]

Year Coal Electricity Natural
Gas
Petroleum Renewable Total
Energy
Consumption
Aviation
Gasoline
Diesel
Fuel
Jet
Fuel
Lubri­cants Motor
Gasoline
Propane Residual
Fuel
Fuel
Ethanol
1999 0.000 0.000 2.952 0.358 76.784 8.870 2.235 101.145 0.053 0.000 1.973 194.369
1998 0.000 0.000 2.889 0.319 77.114 6.132 2.212 98.667 0.087 0.000 1.655 189.074
1997 0.000 0.000 4.289 0.452 68.824 6.097 2.113 97.467 0.273 0.000 1.588 181.102
1996 0.000 0.000 4.641 0.381 67.798 5.712 2.000 96.077 0.082 0.000 1.393 178.083
1995 0.000 0.000 3.365 0.386 55.524 5.671 2.061 94.488 0.087 0.000 2.154 163.736
1994 0.000 0.000 3.256 0.382 50.723 7.028 2.097 88.625 0.276 0.000 1.810 154.196
1993 0.000 0.000 2.479 0.361 48.879 6.419 2.006 87.890 0.184 0.000 2.687 150.904
1992 0.000 0.000 2.519 0.409 49.718 6.623 1.970 86.229 0.182 0.000 3.250 154.150
1991 0.000 0.000 2.333 0.426 46.020 6.598 1.932 85.308 0.247 0.000 2.732 148.328
1990 0.000 0.000 3.479 0.418 43.829 8.291 2.160 88.802 0.234 0.000 2.314 151.841
1989 0.000 0.000 4.847 0.470 44.470 8.163 2.099 88.029 0.252 0.000 2.543 153.416
1988 0.000 0.000 4.620 0.483 52.134 8.249 2.046 89.425 0.197 0.000 2.035 161.224
1987 0.000 0.000 4.400 0.453 44.792 7.508 2.122 84.778 0.192 0.001 1.886 148.017
1986 0.000 0.000 3.885 0.592 39.832 7.402 1.877 84.777 0.145 0.001 1.507 141.525
1985 0.000 0.000 5.454 0.486 39.077 7.424 1.920 83.587 0.218 0.000 1.442 141.050
1984 0.000 0.000 4.529 0.538 36.552 7.592 2.060 86.803 0.275 0.000 1.525 141.399
1983 0.000 0.000 3.991 0.600 39.829 8.135 1.932 86.299 0.790 0.000 1.378 144.331
1982 0.000 0.000 5.099 0.620 29.737 7.948 1.845 88.223 0.665 0.000 0.685 135.508
1981 0.000 0.000 6.004 1.080 25.215 8.010 2.023 88.095 0.804 0.019 0.274 131.798
1980 0.000 0.000 6.878 1.075 29.775 8.687 2.109 91.821 0.656 0.000 0.000 141.002

Return to top of page

Energy Consumption by Fuel Type, Transportation Sector, Nebraska,
1960 – 1979

[Trillion British Thermal Units (Btu)]

Year Coal Electricity Natural
Gas
Petroleum Renewable Total
Energy
Consumption
Aviation
Gasoline
Diesel
Fuel
Jet
Fuel
Lubri­cants Motor
Gasoline
Propane Residual
Fuel
Fuel
Ethanol
1979 0.000 0.000 7.010 0.913 35.944 10.500 2.369 98.623 0.669 0.087 0.000 156.115
1978 0.000 0.000 8.952 1.043 41.943 10.987 2.264 106.775 0.973 0.028 0.000 172.966
1977 0.001 0.000 12.256 0.925 37.001 9.762 2.108 105.316 0.843 0.162 0.000 168.374
1976 0.001 0.000 10.370 0.697 30.247 9.328 2.014 104.252 1.056 0.217 0.000 158.183
1975 0.001 0.000 10.391 0.713 26.898 9.235 1.813 99.131 0.886 0.868 0.000 149.934
1974 0.003 0.000 11.613 0.876 28.647 9.889 1.996 98.137 0.955 1.070 0.000 153.187
1973 0.005 0.000 13.766 0.867 29.976 9.148 2.084 105.713 0.898 1.036 0.000 163.492
1972 0.004 0.000 13.317 0.450 28.186 9.435 2.053 100.087 0.896 1.120 0.000 155.549
1971 0.005 0.000 13.341 0.995 22.043 9.926 1.918 92.547 0.949 1.097 0.000 142.820
1970 0.008 0.000 13.240 1.002 21.311 9.773 1.934 89.805 0.832 1.418 0.000 139.322
1969 0.006 0.000 11.447 1.177 18.354 11.157 1.898 86.026 1.046 1.312 0.000 132.425
1968 0.007 0.000 9.970 2.807 17.914 11.576 1.936 83.224 1.015 1.372 0.000 129.822
1967 0.013 0.000 10.215 1.681 11.590 10.074 1.762 78.322 0.903 1.881 0.000 116.442
1966 0.025 0.000 9.293 1.827 8.317 8.189 1.861 76.773 0.707 0.679 0.000 107.673
1965 0.025 0.000 8.581 2.067 8.382 7.411 1.792 72.812 0.378 0.685 0.000 102.133
1964 0.036 0.000 8.136 2.236 11.057 8.241 1.853 70.490 0.406 4.671 0.000 107.127
1963 0.041 0.000 6.470 2.161 11.013 8.028 1.765 73.130 0.474 5.252 0.000 108.333
1962 0.041 0.000 6.815 2.133 9.605 7.879 1.765 69.896 0.348 2.680 0.000 101.163
1961 0.045 0.000 6.786 2.101 9.531 7.039 1.935 66.611 0.367 2.209 0.000 96.623
1960 0.154 0.000 6.514 1.870 8.166 6.439 1.988 67.070 0.394 1.625 0.000 94.220

Return to top of page

Sources: State Energy Data Report. Energy Information Administration, Washington, DC. Nebraska Department of Environment and Energy, Lincoln, NE.

Notes: Totals may not equal the sum of the components due to independent rounding. Denaturant is excluded from fuel ethanol.

The tables and graphs were updated on January 9, 2024.
Typically, there are one to two years between updates.

Return to top of page