Nebraska Department of Environment and Energy

Air Water Land Energy

Nebraska Energy Statistics

Energy Prices in
Nebraska's Industrial Sector

The industrial sector consists of manufacturing, construction, mining, agriculture, and forestry organizations. Energy used by this sector to transport products to market or inputs to the organizations is included in the transportation sector.

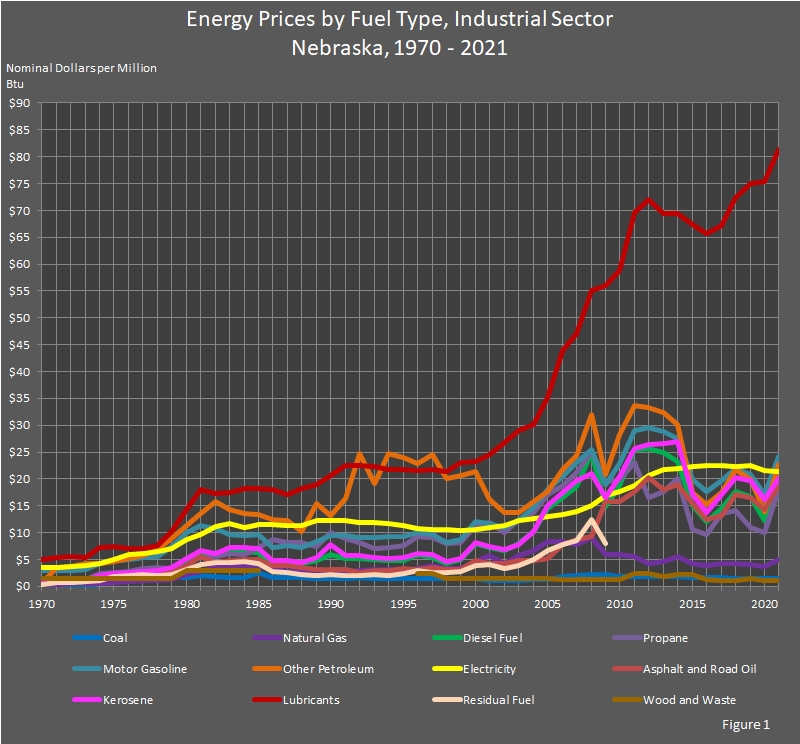
Using an equivalent measure of million British thermal units (Btu), the graph below compares the prices of fuel. The prices are also in nominal dollars to provide a better comparison. In 2021, the highest price was for lubricants at $81.25 per million Btu. The price of motor gasoline was $24.22, petroleum products in the 'other petroleum' category was $22.67 (see definition in next paragraph), electricity was $21.29, kerosene was $20.06, asphalt and road oil was $18.68, propane was $18.00, diesel fuel was $17.34, natural gas was $5.04, coal was $1.42, and wood and waste was $0.99. The price of residual fuel was not reported.

Other petroleum products include sixteen (16) separate products, all of which are assigned to the industrial sector. The sixteen products are:

  1. aviation gasoline blending components;
  2. crude oil;
  3. motor gasoline blending components;
  4. natural gasoline, including isopentane;
  5. pentanes plus;
  6. petrochemical feedstocks, naphtha;
  7. petrochemical feedstocks, other oils;
  8. petrochemical feedstocks, still gas;
  9. petroleum coke;
  10. plant condensate;
  11. special naphthas;
  12. still gas;
  13. unfinished oils;
  14. unfractionated streams;
  15. waxes; and
  16. miscellaneous.
    • Miscellaneous products vary from inexpensive (absorption oils similar to kerosene) to very expensive (hydraulic fluids) products. The greater part of the miscellaneous product line consists of finished petrochemicals, especially the aromatic hydrocarbons:  benzene, toluene, and the xylenes.

The price for ethanol is not tracked, and there are no direct fuel costs for hydroelectric, geothermal, wind, photovoltaic, or solar thermal energy, so no prices were reported.

Return to top of page

chart showing Energy Prices by Fuel Type in the Industrial Sector in Nebraska.

Return to top of page

Energy Prices by Fuel Type,
Industrial Sector,
Nebraska, 2010 – 2021

[Nominal Dollars per Million British Thermal Units (Btu)]

Year Coal Electricity Natural Gas Petroleum Renewable Annual Average
Asphalt and Road Oil Diesel Fuel Kerosene Lubricants Motor Gasoline Other Petroleum1 Propane Residual Fuel Wood and Waste
2021 $1.42 $21.29 $5.04 $18.68 $17.34 $20.06 $81.25 $24.22 $22.67 $18.00 $0.00 $0.99 $10.94
2020 $1.39 $21.63 $3.64 $14.22 $12.27 $16.13 $75.34 $17.15 $13.87 $9.94 $0.00 $1.13 $9.14
2019 $1.38 $22.43 $3.99 $16.60 $16.65 $19.72 $74.92 $20.90 $19.92 $10.89 $0.00 $1.33 $10.06
2018 $1.54 $22.27 $4.23 $11.78 $17.67 $20.34 $72.37 $21.93 $21.66 $14.09 $0.00 $0.95 $10.19
2017 $1.66 $22.45 $4.28 $8.74 $14.56 $17.01 $67.25 $19.78 $17.81 $13.52 $0.00 $1.09 $9.80
2016 $1.62 $22.54 $3.82 $8.38 $12.04 $13.67 $65.78 $17.62 $15.31 $9.66 $0.00 $1.23 $9.07
2015 $1.71 $22.25 $4.31 $12.02 $14.95 $17.07 $67.28 $19.80 $17.53 $16.61 $0.00 $1.87 $9.80
2014 $1.82 $21.90 $5.46 $15.60 $23.29 $26.97 $69.44 $27.59 $30.04 $23.73 $15.88 $1.86 $11.73
2013 $1.80 $21.81 $4.55 $14.85 $24.96 $26.68 $69.42 $28.85 $32.31 $20.82 $0.00 $1.70 $11.84
2012 $1.87 $20.54 $4.26 $15.22 $25.56 $26.46 $72.11 $29.59 $33.28 $19.58 $0.00 $2.41 $12.14
2011 $1.85 $18.85 $5.55 $14.08 $25.36 $25.62 $69.54 $28.96 $33.43 $24.59 $0.00 $2.41 $11.59
2010 $1.87 $17.60 $5.83 $12.87 $18.76 $20.38 $52.62 $22.74 $27.94 $22.05 $0.00 $1.35 $10.64

Return to top of page

Energy Prices by Fuel Type,
Industrial Sector,
Nebraska, 1990 – 2009

[Nominal Dollars per Million British Thermal Units (Btu)]

Year Coal Electricity Natural Gas Petroleum Renewable Annual Average
Asphalt and Road Oil Diesel Fuel Kerosene Lubricants Motor Gasoline Other Petroleum1 Propane Residual Fuel Wood and Waste
2009 $2.27 $16.86 $5.95 $10.93 $14.82 $16.50 $56.07 $19.00 $20.84 $19.43 $7.94 $1.35 $10.18
2008 $2.26 $15.12 $9.02 $9.35 $24.88 $21.09 $55.12 $25.38 $31.90 $25.18 $12.35 $1.35 $13.73
2007 $2.10 $14.00 $7.83 $8.69 $18.59 $19.62 $47.16 $22.94 $24.32 $21.12 $8.55 $1.35 $11.98
2006 $1.89 $13.35 $8.27 $7.79 $16.52 $17.50 $43.88 $20.49 $21.84 $18.82 $7.75 $1.35 $11.74
2005 $1.28 $12.98 $8.30 $5.16 $14.46 $15.00 $35.22 $17.92 $17.66 $17.00 $6.62 $1.46 $11.06
2004 $1.21 $12.55 $6.62 $4.77 $10.13 $10.14 $30.11 $14.58 $15.81 $13.76 $5.03 $1.46 $9.16
2003 $1.13 $12.25 $5.82 $4.75 $7.88 $7.78 $28.94 $12.24 $13.77 $12.37 $3.87 $1.46 $8.04
2002 $1.15 $11.39 $4.21 $4.32 $6.60 $6.81 $26.70 $10.88 $13.83 $9.96 $3.40 $1.46 $6.79
2001 $1.14 $11.03 $5.77 $4.28 $7.28 $7.39 $24.51 $11.58 $16.07 $11.93 $4.05 $1.46 $7.31
2000 $1.39 $10.59 $4.60 $4.74 $7.97 $8.17 $23.20 $12.07 $21.33 $11.25 $3.93 $1.50 $6.89
1999 $1.45 $10.47 $3.38 $3.12 $5.02 $5.14 $23.04 $8.72 $20.54 $8.08 $2.69 $1.50 $5.33
1998 $1.42 $10.54 $3.25 $3.08 $4.24 $4.64 $21.44 $8.19 $20.11 $7.88 $2.64 $1.50 $5.05
1997 $1.42 $10.59 $3.86 $3.43 $5.37 $6.00 $21.82 $9.62 $24.62 $9.02 $2.65 $2.42 $5.79
1996 $1.45 $10.78 $3.27 $3.12 $5.86 $6.11 $21.63 $10.02 $22.95 $9.26 $2.94 $2.43 $5.82
1995 $1.42 $11.26 $2.85 $3.27 $4.87 $5.39 $21.75 $9.21 $23.89 $7.59 $2.38 $0.00 $5.25
1994 $1.46 $11.70 $3.17 $2.91 $4.86 $5.17 $21.71 $9.21 $24.75 $7.24 $2.08 $0.00 $5.38
1993 $1.43 $11.83 $3.17 $2.92 $5.00 $5.41 $22.37 $9.11 $19.10 $7.03 $2.27 $0.00 $5.37
1992 $1.57 $11.91 $2.98 $2.62 $5.16 $5.76 $22.49 $9.09 $24.75 $8.24 $1.97 $0.00 $5.77
1991 $1.43 $12.17 $2.80 $3.18 $5.22 $5.80 $22.58 $9.43 $16.33 $8.91 $2.03 $0.00 $5.80
1990 $1.48 $12.28 $3.02 $3.15 $5.87 $7.81 $20.61 $9.49 $13.13 $9.99 $2.22 $0.00 $6.18

Return to top of page

Energy Prices by Fuel Type,
Industrial Sector,
Nebraska, 1970 – 1989

[Nominal Dollars per Million British Thermal Units (Btu)]

Year Coal Electricity Natural Gas Petroleum Renewable Annual Average
Asphalt and Road Oil Diesel Fuel Kerosene Lubricants Motor Gasoline Other Petroleum1 Propane Residual Fuel Wood and Waste
1989 $1.47 $12.34 $2.96 $3.09 $4.72 $5.32 $18.90 $8.42 $15.43 $7.50 $2.02 $0.00 $5.50
1988 $1.57 $11.28 $2.90 $3.54 $4.16 $4.49 $18.18 $7.22 $10.24 $8.14 $2.13 $0.00 $5.05
1987 $1.62 $11.34 $2.81 $3.85 $4.50 $4.89 $17.04 $7.58 $12.20 $8.17 $2.60 $0.00 $5.19
1986 $1.67 $11.42 $3.28 $3.93 $4.04 $4.81 $18.02 $7.28 $12.52 $8.66 $2.81 $0.00 $5.36
1985 $2.51 $11.47 $3.67 $5.04 $6.25 $7.08 $18.18 $9.67 $13.38 $7.28 $4.28 $3.00 $6.22
1984 $1.70 $10.96 $3.71 $4.96 $6.57 $7.18 $18.14 $9.55 $13.48 $5.87 $4.65 $3.00 $5.86
1983 $1.67 $11.71 $3.79 $4.85 $6.67 $7.31 $17.42 $9.61 $14.29 $6.12 $4.47 $3.00 $6.08
1982 $1.79 $11.06 $3.62 $4.46 $5.72 $6.06 $17.25 $10.71 $15.76 $5.50 $4.44 $3.00 $5.64
1981 $1.97 $9.66 $2.84 $5.50 $6.40 $6.74 $18.00 $11.37 $13.57 $5.31 $4.09 $3.00 $5.35
1980 $1.69 $8.71 $2.21 $3.89 $4.94 $5.17 $14.36 $10.06 $11.23 $5.25 $3.13 $3.00 $4.51
1979 $1.72 $7.07 $1.26 $2.58 $3.34 $3.53 $10.21 $7.41 $8.88 $3.39 $2.28 $1.44 $3.08
1978 $1.47 $6.54 $1.11 $2.20 $2.76 $3.00 $7.60 $5.50 $6.93 $3.44 $2.03 $1.44 $2.56
1977 $1.17 $6.02 $1.02 $2.05 $2.53 $2.73 $6.97 $5.29 $5.78 $3.23 $2.27 $1.44 $2.27
1976 $1.03 $5.83 $0.85 $2.04 $2.39 $2.57 $7.05 $5.06 $5.12 $2.73 $1.93 $1.44 $2.09
1975 $0.81 $4.96 $0.69 $2.07 $2.25 $2.39 $7.48 $4.76 $4.56 $2.50 $1.74 $1.44 $1.77
1974 $0.57 $4.20 $0.54 $1.79 $1.85 $2.00 $7.22 $4.27 $4.32 $2.44 $1.14 $1.44 $1.47
1973 $0.24 $3.95 $0.43 $0.87 $0.94 $1.01 $5.33 $3.21 $4.31 $1.30 $0.86 $1.44 $0.94
1972 $0.22 $3.76 $0.48 $0.86 $0.79 $0.85 $5.58 $3.00 $3.77 $1.16 $0.64 $1.44 $1.00
1971 $0.41 $3.57 $0.36 $0.83 $0.79 $0.85 $5.27 $3.00 $3.48 $1.19 $0.65 $1.44 $0.97
1970 $0.16 $3.42 $0.32 $0.71 $0.73 $0.79 $5.08 $3.03 $0.43 $1.10 $0.40 $1.44 $0.88

Return to top of page

Sources: State Energy Price and Expenditure Report. Energy Information Administration, Washington, DC. Nebraska Department of Environment and Energy, Lincoln, NE.

Notes: The average column contains the average price of all industrial sector energy sources for each year.

1 Other petroleum includes the subtotal of sixteen (16) petroleum products consumed in the industrial sector.

The table and graph were updated on January 9, 2024.
Typically, there are one to two years between updates.

Return to top of page