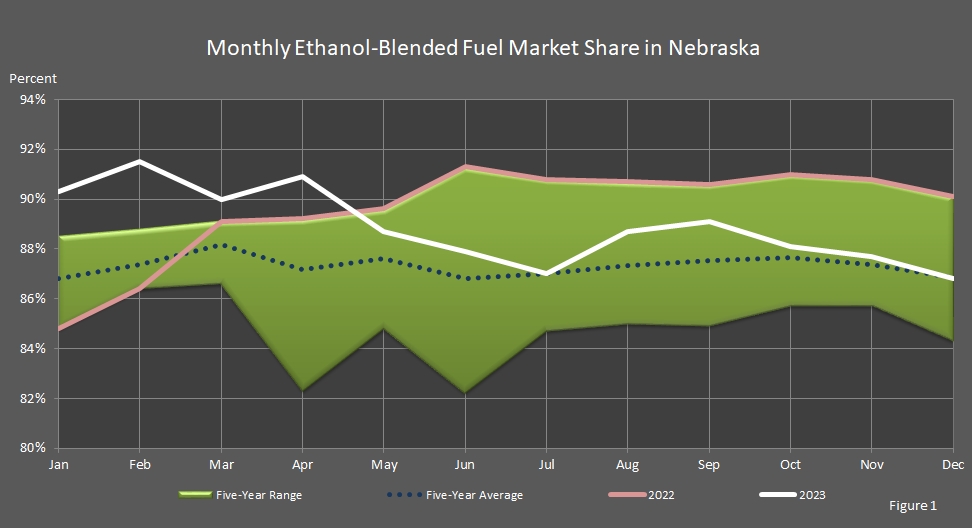
In Nebraska, most ethanol is sold in a blended fuel—10 percent ethanol with 90 percent gasoline (called E-10) or 85 percent ethanol with 15 percent gasoline (called E85). Of the total gasoline and ethanol–blended fuel sold in the state in December 2023, 86.8 percent was an ethanol blend. The market share for ethanol–blended fuel is shown in Figure 1 and the data table below on a monthly basis. In Figure 1, it can be seen that December 2023's percentage is in the center of the five–year range, equivalent to the five–year average, but way below December 2022's percentage.
Nebraska Department of Environment and Energy
Air Water Land Energy
Nebraska Energy Statistics
Ethanol-Blended Fuel Monthly Market Share
in Nebraska
| Year | Jan | Feb | Mar | Apr | May | Jun | Jul | Aug | Sep | Oct | Nov | Dec |
|---|---|---|---|---|---|---|---|---|---|---|---|---|
| 2023 | 90.3% | 91.5% | 90.0% | 90.9% | 88.7% | 87.9% | 87.0% | 88.7% | 89.1% | 88.1% | 87.7% | 86.8% |
| 2022 | 84.8% | 86.4% | 89.1% | 89.2% | 89.6% | 91.3% | 90.8% | 90.7% | 90.6% | 91.0% | 90.8% | 90.1% |
| 2021 | 85.4% | 86.4% | 88.5% | 88.3% | 87.6% | 86.4% | 87.7% | 86.8% | 87.4% | 85.7% | 85.8% | 84.3% |
| 2020 | 87.3% | 88.2% | 86.6% | 82.3% | 84.8% | 82.2% | 84.7% | 85.0% | 84.9% | 85.7% | 85.7% | 86.4% |
| 2019 | 88.0% | 88.8% | 88.5% | 88.3% | 87.9% | 86.2% | 85.3% | 86.7% | 86.8% | 86.7% | 86.6% | 86.3% |
| 2018 | 88.5% | 87.0% | 88.2% | 87.7% | 88.2% | 87.9% | 86.6% | 87.5% | 87.9% | 89.1% | 88.0% | 87.1% |
| 2017 | 87.0% | 87.4% | 85.7% | 86.9% | 88.0% | 85.4% | 86.1% | 87.6% | 89.5% | 89.8% | 89.1% | 88.3% |
| 2016 | 85.7% | 84.1% | 86.0% | 84.9% | 85.0% | 85.1% | 84.6% | 87.8% | 86.4% | 87.3% | 87.0% | 87.8% |
| 2015 | 86.2% | 85.4% | 87.2% | 84.7% | 83.6% | 83.2% | 83.9% | 85.5% | 86.6% | 85.2% | 84.9% | 84.4% |
| 2014 | 87.5% | 88.3% | 90.3% | 88.1% | 86.2% | 85.8% | 86.3% | 85.6% | 84.3% | 86.2% | 87.9% | 86.8% |
| 2013 | 70.7% | 71.9% | 72.0% | 69.4% | 73.5% | 69.2% | 69.9% | 69.0% | 74.5% | 86.6% | 88.8% | 88.0% |
| 2012 | 77.2% | 88.1% | 84.3% | 87.3% | 81.2% | 82.6% | 74.6% | 74.8% | 75.5% | 74.9% | 75.0% | 70.8% |
| 2011 | 82.3% | 82.7% | 85.6% | 81.8% | 79.5% | 80.2% | 76.3% | 77.1% | 85.6% | 76.9% | 83.1% | 77.2% |
| 2010 | 73.7% | 73.1% | 72.7% | 72.6% | 75.3% | 71.1% | 77.0% | 76.6% | 76.1% | 82.9% | 73.6% | 85.6% |
| 2009 | 58.0% | 60.4% | 66.4% | 72.6% | 66.8% | 69.7% | 67.2% | 69.2% | 70.3% | 70.6% | 72.0% | 72.5% |
| 2008 | 72.6% | 72.5% | 75.0% | 74.7% | 77.3% | 75.7% | 80.7% | 75.0% | 81.8% | 78.2% | 60.9% | 53.9% |
| 2007 | 47.4% | 56.4% | 59.6% | 64.4% | 67.1% | 67.4% | 67.6% | 66.6% | 68.3% | 70.3% | 72.4% | 76.8% |
| 2006 | 66.0% | 60.2% | 44.4% | 56.8% | 53.8% | 28.6% | 23.5% | 68.5% | 61.8% | 62.3% | 64.4% | 61.5% |
| 2005 | 53.3% | 56.0% | 59.1% | 67.8% | 68.4% | 67.3% | 67.1% | 67.0% | 63.4% | 60.4% | 58.9% | 64.9% |
| 2004 | 40.6% | 48.8% | 48.7% | 41.9% | 46.7% | 42.6% | 46.5% | 47.2% | 49.2% | 49.7% | 47.4% | 46.1% |
| 2003 | 42.2% | 47.1% | 48.1% | 47.5% | 43.7% | 43.5% | 42.9% | 43.6% | 45.1% | 45.2% | 41.3% | 34.3% |
| 2002 | 33.3% | 35.0% | 38.5% | 38.3% | 38.0% | 39.9% | 37.6% | 37.8% | 37.7% | 40.1% | 41.7% | 40.3% |
| 2001 | 28.2% | 26.6% | 27.5% | 33.9% | 32.9% | 29.9% | 26.5% | 25.7% | 28.2% | 26.6% | 26.5% | 32.5% |
| 2000 | 35.1% | 35.9% | 40.9% | 37.6% | 33.7% | 35.2% | 35.5% | 34.0% | 34.1% | 35.4% | 35.9% | 31.9% |
| 1999 | 25.9% | 24.0% | 25.4% | 21.9% | 22.0% | 22.3% | 21.7% | 22.5% | 24.1% | 28.9% | 31.8% | 33.3% |
| 1998 | 23.8% | 22.8% | 23.1% | 23.1% | 22.9% | 22.5% | 21.1% | 21.1% | 20.8% | 21.5% | 22.1% | 23.7% |
| 1997 | 26.3% | 27.0% | 26.5% | 26.2% | 24.0% | 23.5% | 23.2% | 23.0% | 23.2% | 26.2% | 23.9% | 23.9% |
| 1996 | 30.4% | 28.9% | 26.8% | 25.5% | 23.8% | 22.9% | 20.7% | 19.3% | 17.6% | 17.2% | 19.1% | 18.8% |
| 1995 | 31.5% | 29.6% | 29.9% | 29.3% | 29.6% | 29.1% | 26.3% | 26.2% | 27.4% | 27.3% | 29.3% | 31.1% |
| 1994 | 36.1% | 32.8% | 33.2% | 29.1% | 28.1% | 27.9% | 30.0% | 28.3% | 29.8% | 29.6% | 31.3% | 31.7% |
| 1993 | 53.3% | 41.4% | 41.1% | 38.9% | 33.9% | 30.0% | 31.8% | 30.0% | 31.7% | 30.7% | 34.3% | 33.9% |
Sources: "Monthly Motor–Fuel Consumption." Nebraska Department of Revenue, Motor Fuels Division, Lincoln, NE. Nebraska Department of Environment and Energy, Lincoln, NE.
Notes: NA indicates data is not available. Numbers in red have been revised.
This table and graph were updated on March 14, 2024.
Typically, there is one month between updates.