Nebraska Department of Environment and Energy

Air Water Land Energy

Nebraska Energy Statistics

Nebraska's Energy Intensity

Energy intensity is the ratio of energy input per unit of economic output, or the amount of energy used to produce a dollar's worth of goods and services. This measures the energy efficiency of the state's economy.

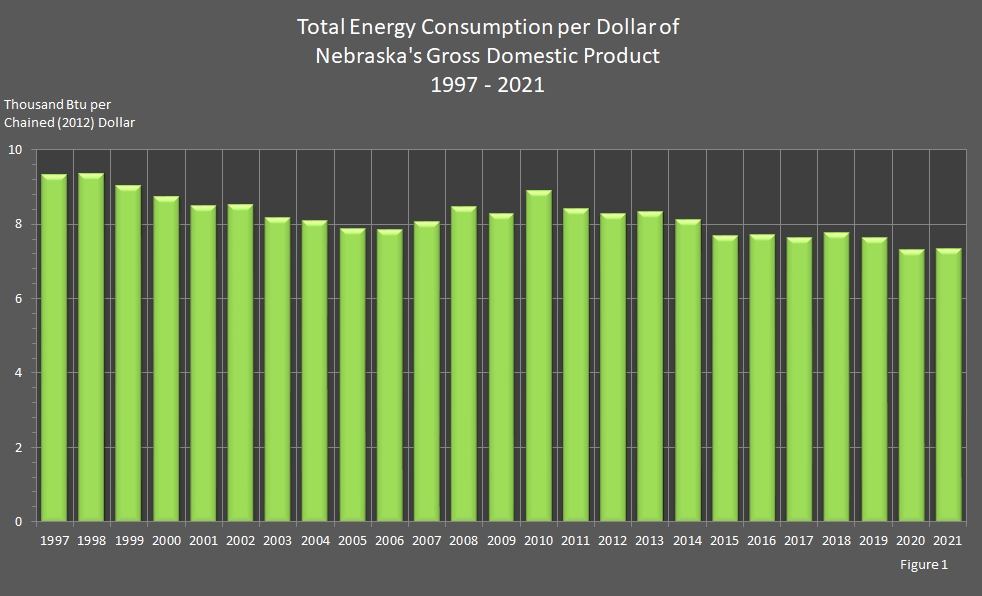
From 1997 to 2021, the State's gross domestic product (GDP) increased 73 percent from $70.7 billion to $122.1 billion, while Nebraska's overall energy consumption grew 36 percent from 658.0 trillion British thermal units (Btu) in 1997 to 898.0 trillion Btu in 2021. Energy intensity was 7.4 thousand Btu per chained (2012) dollar in 2021, which was a 20–percent decrease from 9.3 thousand Btu per chained (2012) dollar in 1997.

A 36–percent increase in Nebraska's total energy consumption resulted in a 73–percent increase of the GDP and a 20–percent decrease in energy intensity. In other words, despite an increase in energy consumption, Nebraska experienced a larger increase in the production of real value in goods and services, which lowered Nebraska's energy intensity. (Using less energy to produce a product reduced the intensity.) This indicates that Nebraskans are using energy more efficiently.

Another measure of energy consumption intensity is reported in Total Energy Consumption Per Capita. An explanation of energy intensity indicators is in the report Energy Intensity Indicators.

The phrase "Gross Domestic Product" is replacing the phrase "Gross State Product." Gross domestic product by state is the state counterpart of the nation's gross domestic product, the U.S. Census Bureau's featured and most comprehensive measure of U.S. economic activity. Gross domestic product by state is derived as the sum of the gross domestic product originating in all the industries in a state.

Return to top of page

chart showing Total Energy Consumption per Dollar of Nebraska'a Gross State Product.

Return to top of page

Energy Consumption per Dollar of
Nebraska's Gross Domestic Product
1997 – 2021

Year Nebraska's Total
Energy Consumption
[Trillion British thermal units (Btu)]
Nebraska's Total
Gross Domestic Product
[Billion Chained (2012) Dollars]
Nebraska's
Energy Consumption per
Dollar of
Gross Domestic Product
[Thousand Btu per
Chained (2012) Dollar]
2021 897.959 $122.136 7.4
2020 863.488 $118.142 7.3
2019 907.219 $118.287 7.7
2018 902.782 $115.088 7.8
2017 876.119 $113.110 7.8
2016 868.334 $110.812 7.8
2015 853.843 $110.326 7.7
2014 870.152 $107.166 8.1
2013 872.672 $105.038 8.3
2012 853.545 $102.269 8.4
2011 863.554 $102.333 8.4
2010 861.588 $97.857 8.8
2009 778.869 $94.050 8.3
2008 796.063 $93.569 8.5
2007 757.842 $93.388 8.1
2006 721.474 $91.387 7.9
2005 704.826 $88.894 7.9
2004 697.628 $86.082 8.1
2003 685.709 $84.120 8.2
2002 675.942 $79.665 8.5
2001 664.390 $78.258 8.5
2000 667.989 $76.623 8.7
1999 664.584 $73.884 9.0
1998 674.687 $72.310 9.3
1997 658.015 $70.722 9.3

Return to top of page

Sources: State Energy Data Report. Energy Information Administration, Washington, DC. Nebraska Department of Environment and Energy, Lincoln, NE.

Note: NA indicates data is not available.

Current versus chained dollars

Current dollars reflect values for the year of the measurement and do not take into account inflationary price changes or component changes over time. Current dollar gross domestic product levels from one year should not be compared to the levels from other years, so for this comparison over time, chained–dollar GDP levels are used.

Change in industry definitions

There is a discontinuity in the "gross domestic product by state" or GDP time series at the year 1997, when the data changed from Standard Industrial Classification (SIC) industry definitions to North American Industry Classification System (NAICS) industry definitions. Since the Bureau of Economic Analysis strongly advises against appending the two data series in an attempt to construct a single time series of gross domestic product, the data in this report cover the time period starting with 1997.

The table and graph were updated on January 11, 2024.
Typically, there are one to two years between updates.

Return to top of page