Nebraska Department of Environment and Energy

Air Water Land Energy

Nebraska Energy Statistics

Energy Expenditures
in Nebraska's Residential Sector

The residential sector consists of private households. Energy is consumed primarily for space heating, water heating, air conditioning, refrigeration, cooking, clothes drying, and lighting. Fuel used for motor vehicles by household members is included in the transportation sector.

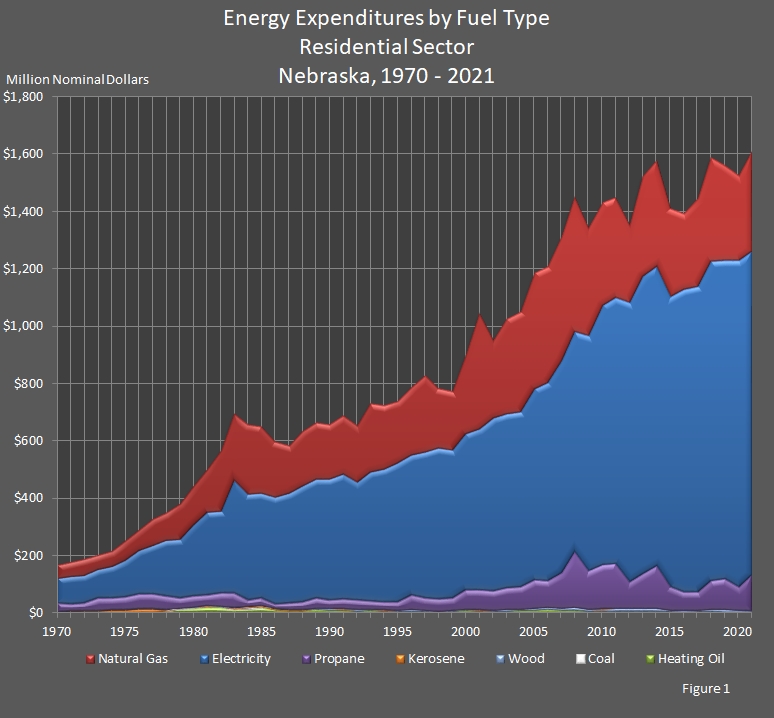
Total residential sector expenditures on energy increased 5.6 percent to $1,608.1 million from 2020 to 2021. In 2021, Nebraska residents spent $1,128.0 million for electricity, $348.9 million for natural gas, $123.3 million for propane, $6.0 million for wood, $1.8 million for heating oil, and $0.2 for kerosene. Since the residential sector's coal consumption was reported as zero in 1998–2000, 2008–2021, the expenditure for coal is shown as $0. If coal was consumed in the residential sector in the years for which zero expenditures were reported, the expenditure was small enough to round to zero in this table. There are no direct fuel costs for hydroelectric, geothermal, wind, photovoltaic, or solar thermal energy.

Electricity expenditures were nearly three–quarters (70.1 percent) of the total money spent in the residential sector on energy in 2021, and expenditures on natural gas were a fifth (21.7 percent). Propane expenditures were 7.7 percent of the total while each of the other fuels' expenditures was less than one percent.

The expenditures are in nominal dollars to provide a better comparison.

chart showing Energy Expenditures by Fuel Type in the Residential Sector in Nebraska.

Energy Expenditures by Fuel Type, Residential Sector
Nebraska, 2010 – 2021

(Million Nominal Dollars)

Year Coal Electricity Heating
Oil
Kerosene Natural
Gas
Propane Wood Annual
Total
2021 $0.0 $1,128.0 $1.8 $0.1 $348.9 $123.3 $6.0 $1,608.1
2020 $0.0 $1,135.3 $0.9 $0.0 $297.5 $84.0 $4.9 $1,522.6
2019 $0.0 $1,109.7 $1.3 $0.1 $328.9 $108.0 $8.4 $1,556.3
2018 $0.0 $1,114.4 $1.5 $0.1 $361.9 $101.0 $7.9 $1,586.9
2017 $0.0 $1,060.4 $1.5 $0.0 $307.0 $68.4 $4.7 $1,442.0
2016 $0.0 $1,055.6 $1.2 $0.1 $264.7 $65.0 $5.1 $1,391.7
2015 $0.0 $1,010.5 $1.5 $0.0 $307.1 $122.0 $6.0 $1,447.2
2014 $0.0 $1,043.0 $2.8 $0.2 $369.6 $185.9 $11.8 $1,613.3
2013 $0.0 $1,037.8 $3.2 $0.1 $345.9 $178.6 $11.8 $1,577.5
2012 $0.0 $972.3 $2.8 $0.1 $271.6 $134.9 $8.8 $1,390.4
2011 $0.0 $927.3 $3.8 $0.1 $351.1 $182.7 $8.4 $1,473.5
2010 $0.0 $903.4 $3.1 $0.5 $359.2 $154.7 $6.9 $1,427.7

Energy Expenditures by Fuel Type, Residential Sector
Nebraska, 1990 – 2009

(Million Nominal Dollars)

Year Coal Electricity Heating
Oil
Kerosene Natural
Gas
Propane Wood Annual
Total
2009 $0.0 $820.3 $3.3 $0.4 $374.9 $196.2 $6.6 $1,340.9
2008 $0.0 $767.6 $7.6 $0.3 $470.6 $196.2 $8.5 $1,450.9
2007 $0.0 $740.0 $6.0 $0.8 $430.3 $126.3 $6.2 $1,309.6
2006 $0.0 $688.8 $10.3 $0.3 $405.6 $96.3 $5.1 $1,206.5
2006 $0.0 $665.0 $7.8 $0.6 $405.4 $102.3 $5.0 $1,186.1
2004 $0.0 $609.7 $6.2 $0.3 $349.7 $78.6 $5.0 $1,049.7
2003 $0.0 $607.8 $4.9 $0.2 $330.3 $77.6 $4.3 $1,025.2
2002 $0.0 $602.9 $3.1 $0.1 $270.8 $70.2 $3.4 $950.7
2001 $0.0 $561.9 $4.2 $0.5 $406.4 $70.2 $3.7 $1,046.9
2000 $0.0 $544.6 $5.8 $0.4 $273.3 $68.9 $3.9 $897.0
1999 $0.0 $517.1 $2.8 $0.2 $205.4 $46.7 $2.4 $774.5
1998 $0.0 $526.8 $2.2 $0.2 $209.2 $42.6 $2.3 $783.3
1997 $0.5 $510.0 $3.6 $0.2 $268.0 $43.7 $3.0 $829.0
1996 $0.0 $487.0 $4.6 $0.1 $238.8 $53.5 $3.8 $787.8
1995 $0.1 $484.1 $3.0 $0.1 $217.8 $31.7 $3.2 $740.0
1994 $0.1 $465.4 $4.8 $0.2 $222.6 $29.3 $3.3 $725.5
1993 $0.0 $451.6 $5.5 $0.4 $239.5 $31.6 $3.6 $732.2
1992 $0.1 $411.4 $4.6 $0.4 $199.5 $34.7 $4.4 $655.1
1991 $0.1 $435.0 $7.2 $0.2 $207.5 $35.6 $4.5 $690.1
1990 $0.0 $423.4 $7.7 $0.2 $190.9 $31.9 $4.5 $658.7

Energy Expenditures by Fuel Type, Residential Sector
Nebraska, 1970 – 1989

(Million Nominal Dollars)

Year Coal Electricity Heating
Oil
Kerosene Natural
Gas
Propane Wood Annual
Total
1989 $0.1 $414.0 $9.1 $0.3 $200.6 $39.6 $2.9 $666.6
1988 $0.5 $405.0 $5.2 $0.6 $194.0 $27.4 $2.6 $635.3
1987 $0.0 $381.4 $5.8 $0.5 $169.5 $27.3 $2.4 $586.9
1986 $0.0 $372.6 $8.5 $0.7 $194.0 $19.9 $3.0 $598.7
1985 $0.2 $365.5 $16.3 $1.8 $233.9 $29.7 $4.1 $651.6
1984 $1.5 $371.0 $12.2 $2.5 $243.3 $23.0 $4.2 $657.7
1983 $0.8 $392.7 $10.4 $2.0 $234.1 $53.4 $3.4 $696.8
1982 $0.4 $286.0 $16.7 $1.5 $213.6 $46.1 $3.7 $568.0
1981 $0.2 $288.0 $18.2 $1.5 $151.5 $38.9 $3.2 $501.5
1980 $0.3 $249.1 $14.4 $0.4 $133.5 $40.2 $2.9 $440.7
1979 $0.8 $206.8 $13.0 $0.7 $123.3 $36.9 $0.6 $382.2
1978 $0.3 $197.1 $5.1 $6.0 $94.8 $46.4 $0.4 $350.2
1977 $0.2 $169.1 $4.3 $7.4 $95.1 $54.1 $0.3 $330.5
1976 $0.1 $150.1 $4.2 $7.4 $75.1 $55.5 $0.3 $292.7
1975 $0.1 $130.3 $2.6 $5.8 $68.9 $47.0 $0.2 $254.9
1974 $0.1 $111.2 $2.6 $6.1 $56.3 $42.4 $0.2 $219.0
1973 $0.2 $99.9 $1.7 $5.3 $52.4 $45.7 $0.1 $205.4
1972 $0.4 $96.3 $1.6 $4.2 $59.4 $29.8 $0.1 $191.9
1971 $0.3 $95.9 $1.4 $3.6 $53.2 $26.3 $0.1 $180.8
1970 $0.4 $87.0 $1.4 $3.0 $49.6 $28.5 $0.1 $170.0

Sources: State Energy Price and Expenditure Report. Energy Information Administration, Washington, DC. Nebraska Department of Environment and Energy, Lincoln, NE.

Note: Totals may not equal the sum of the components due to independent rounding.

The table and graph were updated on January 9, 2024.             
Typically, there are one to two years between dates.

Return to top of page